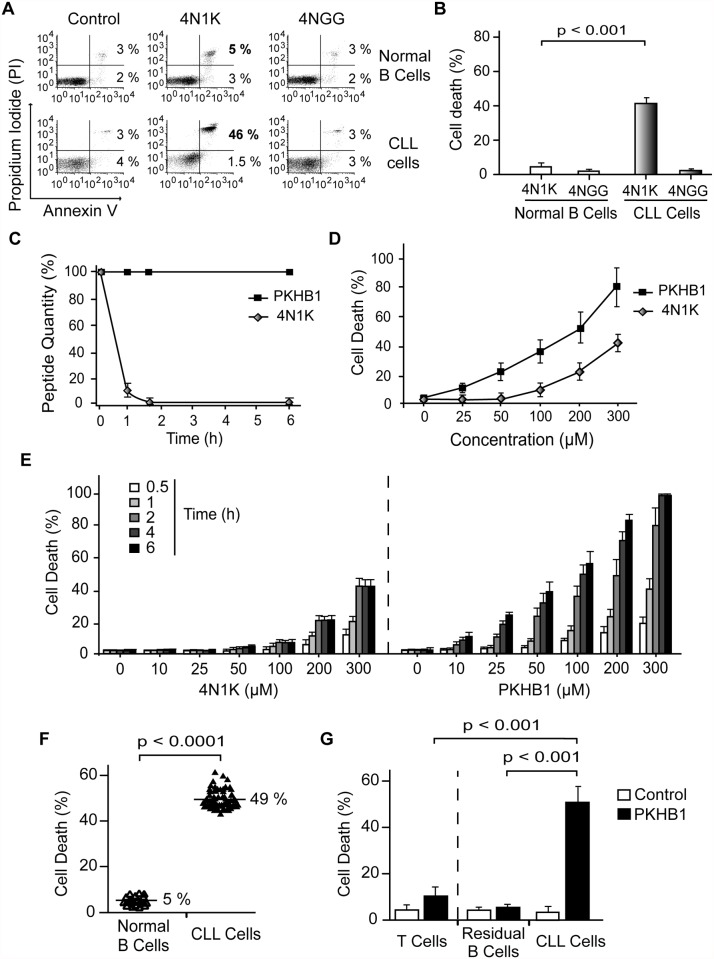
Fig 1. PKHB1 selectively induces cell death in leukemic B cells, including those from patients with dysfunctional TP53.
(A) Cell viability measured by Annexin-V and PI staining in normal or CLL B lymphocytes treated with 4N1K (300 μM, 2 h) or the negative control peptide 4NGG (300 μM, 2 h). The percentages refer to Annexin-V-positive or Annexin-V-positive/PI-positive staining. (B) B cells from healthy donors (n = 8) and CLL patients (n = 20) were treated and analyzed as in (A) and graphed. The panel of patients used here included an equal number of CLL patients with Binet Stage A and Binet Stage B/C. Cell death refers to Annexin-V-positive/PI-positive labeling. (C) The proteolytic stabilities of 4N1K and PKHB1 were evaluated in human serum at the indicated times. A mixture of peptide and human plasma was incubated at 37°C, and the kinetics of degradation was followed using HPLC. The relative concentrations of the remaining soluble peptides were analyzed by the integration of the absorbance at 220 nm as a function of retention time. (D) Cell death, measured as Annexin-V and PI co-positivity, was assessed as in (A) in leukemic cells treated with different concentrations of 4N1K or PKHB1. The data in the plot are the mean ± standard deviation (SD) (n = 5). (E) After treatment with the indicated concentration of 4N1K or PKHB1 for the indicated time, cell viability was assessed in the CLL cells using Annexin-V-positive/PI-positive staining. The data are graphed as mean ± SD (n = 6). (F) Cell death induced by PKHB1 (200 μM, 2 h) was measured in B cells from 20 healthy donors and the cohort of 80 CLL patients described in Tables 1–3. The percentages refer to the mean of the Annexin-V-positive/PI-positive staining. Statistical significance was analyzed with the t-test. (G) Cell death was measured as in (F) in PKHB1-treated CD19−/CD3+ T cells (T cells), CD19+/CD5− B cells (residual B cells), and CD19+/CD5+ B lymphocytes (CLL cells) from CLL patients. The data, which refer to Annexin-V and PI co-positivity, are presented as mean ± SD (residual and leukemic B cells, n = 20; T cells, n = 8). Unless otherwise indicated, the statistical analyses included in this figure were performed with the Mann-Whitney test.

