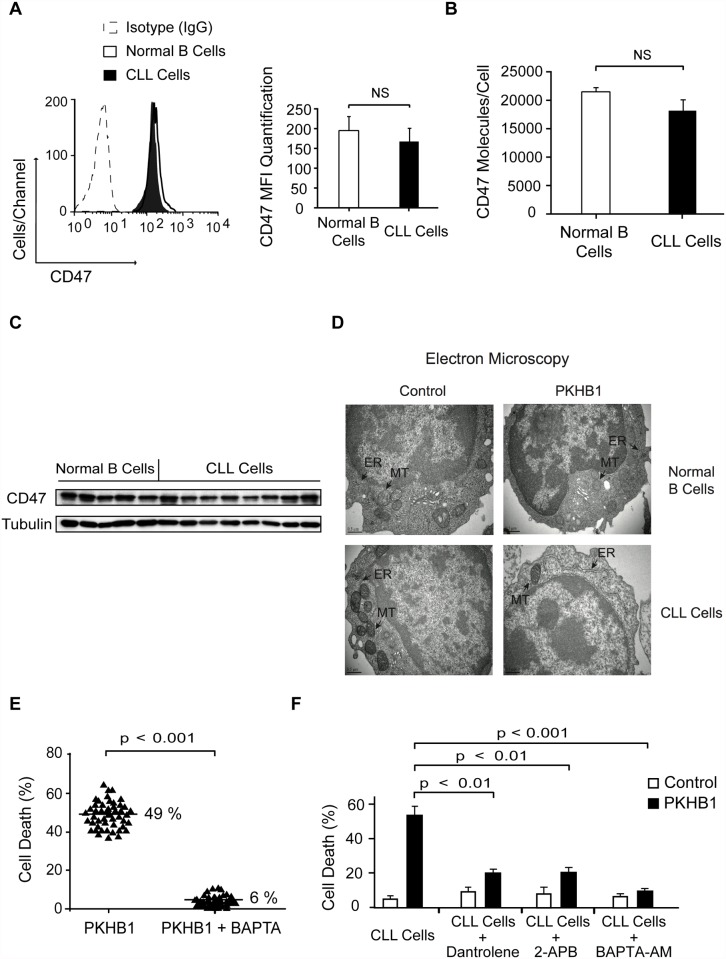
Fig 3. PKHB1 generates endoplasmic reticulum stress that provokes Ca2+-mediated PCD in the CLL cells.
(A) CD47 expression was quantified using flow cytometry in normal and CLL B cells. A representative cytofluorometric plot is presented. In the bar chart, CD47 was quantified based on the MFI in each sample. The data are presented as mean ± SD (normal B cells, n = 20 healthy donors; CLL cells, n = 50 patients). (B) The cell surface expression of CD47 was quantified using a QuantiBRITE flow cytometry system. The number of CD47 molecules/cell in normal (n = 5 healthy donors) and CLL (n = 12 patients) B cells is plotted. (C) CD47 expression in normal and CLL B lymphocytes was determined by immunoblot analysis. Equal loading was confirmed by α-tubulin probing. (D) Representative electron micrographs of untreated (control) or 200-μM PKHB1-treated normal and CLL B cells (2 h of treatment). The black arrows denote the endoplasmic reticulum (ER) and the mitochondria (MT). Bar: 0.5 μm. (E) Cell death was measured in PKHB1-treated B cells (200 μM, 2 h) from 50 CLL patients pre-incubated with vehicle or the external Ca2+ chelator BAPTA. The percentages refer to the mean of the Annexin-V-positive/PI-positive staining. (F) Cell death was measured by Annexin-V-positive/PI-positive labeling in PKHB1-treated CLL cells (200 μM, 2 h) pre-incubated with vehicle, dantrolene, 2-APB, or BAPTA-AM. The data are plotted as mean ± SD (n = 10). Statistical relevance was assessed with the Mann-Whitney test in (A) and (B) and the t-test in (E) and (F).NS, not significant.

