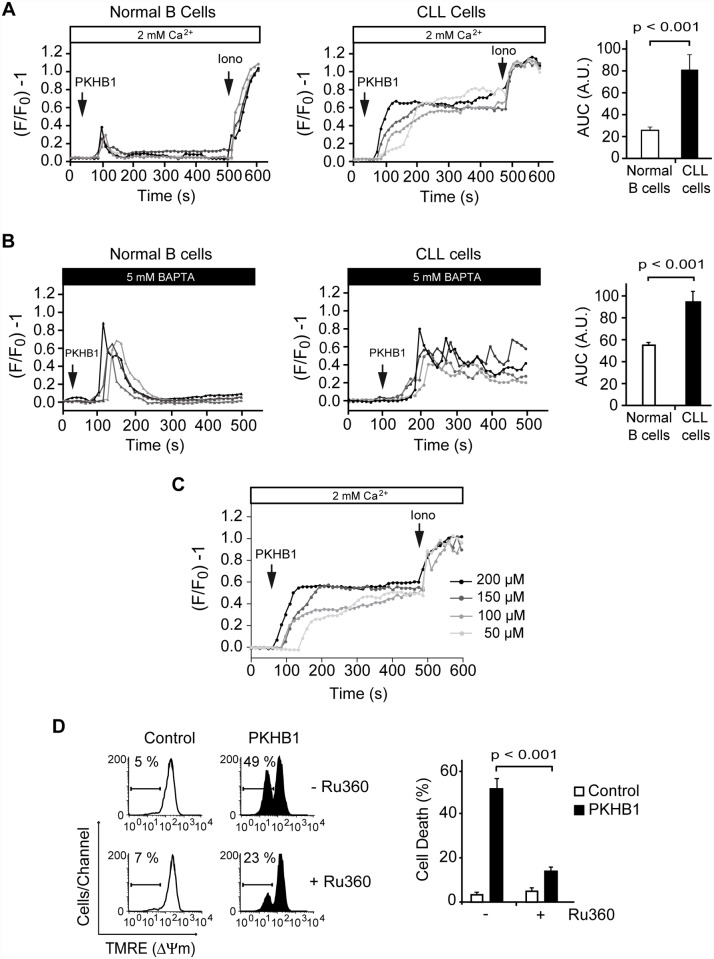
Fig 4. PKHB1 treatment results in sustained Ca2+ mobilization that induces mitochondrial damage and PCD in CLL cells.
(A) Representative Ca2+ mobilization recorded in 200-μM PKHB1-treated normal (left) and CLL (right) B cells (n = 4 each). Ionomycin (Iono, 1 μM) was utilized as a control to show the maximum response. The histograms show mean ± SD of the area under the curve (AUC) (in arbitrary units [A.U.]) (n = 12). (B) Representative Ca2+ release from internal stores was visualized in PKHB1-treated normal (left) and CLL (right) B cells (n = 4 each) in Ca2+-free medium (plus 5 mM BAPTA). Histograms represent mean ± SD of the area under the curve (n = 13). (C) Representative Ca2+ mobilization curves were recorded in CLL cells after treatment with different concentrations of PKHB1. Ionomycin (1 μM) was used as a control to show the maximum response. (D) The loss of ΔΨm induced by PKHB1 (200 μM, 2 h) was measured in CLL cells pre-incubated with vehicle (−) or the mitochondrial Ca2+ uniporter inhibitor Ru360 (+). Representative cytofluorometric plots are shown. The percentages refer to cells with low ΔΨm. The data from eight patients are presented in a plot as mean ± SD. The Mann-Whitney test was used in (A) and (B) and the t-test in (D).

