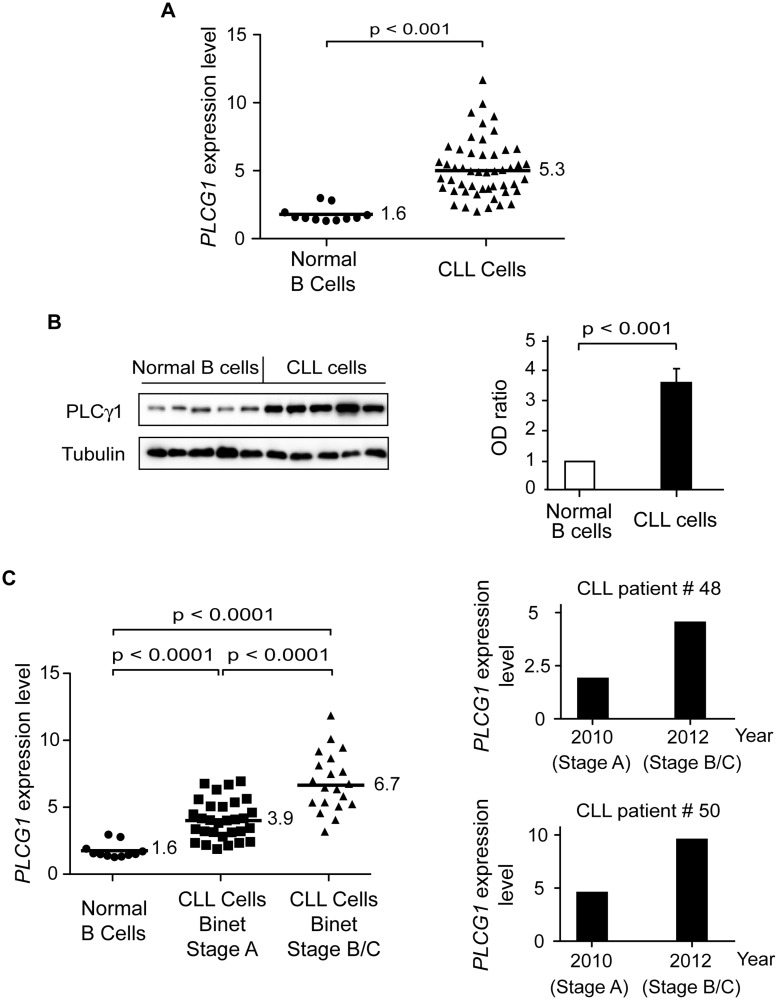
Fig 5. PLCγ1 is over-expressed in CLL cells.
(A) PLCG1 mRNA levels were determined in normal (n = 11) and CLL (n = 50) B cells. The numbers refer to mean PLCG1 transcript expression. GUSB mRNA expression was used to normalize the data. (B) PLCγ1 was detected by immunoblot analysis in normal and CLL B lymphocytes. Equal loading was confirmed by α-tubulin detection. The optical density (OD) ratio represents the difference in protein expression. The plot depicts mean ± SD (n = 3 independent blots). (C) Left: PLCG1 mRNA levels measured in the normal and leukemic B cells used in (A) are shown by the clinical Binet stage of the CLL patients. The numbers refer to mean PLCG1 mRNA expression. Right: PLCG1 mRNA levels measured in patients #48 and #50 at different times. In 2010, both CLL patients were classified as having Binet Stage A, and in 2012 as having Binet Stage B/C. Note that the PLCG1 mRNA levels measured in these patients correlate with CLL progression. GUSB mRNA expression was used to normalize the data. The t-test was used in (A) and (C), and the Mann-Whitney test was used in (B).

