
Fig. 2.
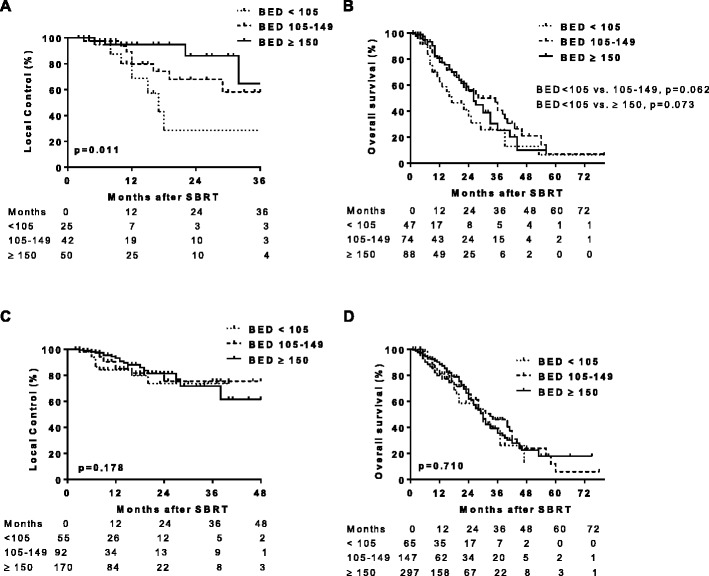
Local control (LC) and overall survival (OS) for T1 and T2 lesions treated with BED10 < 105 Gy vs. 105-149 Gy vs. ≥150 Gy. Kaplan-Meier analysis of LC for T2 (a) and T1 (c) lesions and OS for T2 (b) and T1 (d) lesions treated with BED10 < 105 Gy (dotted line), BED10 105–149 (dashed line), and BED10 ≥ 150 Gy (solid line). Tick marks indicate censored patients. LC improved for T2 lesions treated with BED10 (p = 0.011 by log-rank test), but not T1 lesions. There was a trend for improved OS for T2 lesions treated with BED10105–149 compared to BED10 < 105 although it did not reach statistical significance (p = 0.062 by log-rank test)