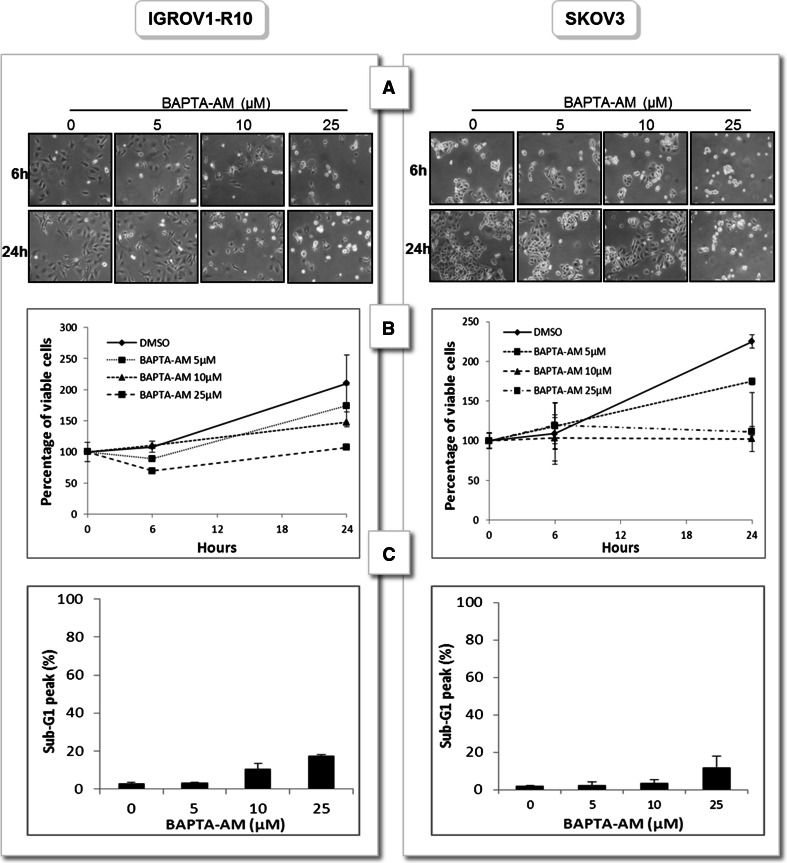
Fig. 1.
Cytostatic effect of calcium chelator BAPTA-AM. IGROV1-R10 and SKOV3 cells were treated or not (DMSO) with increasing concentrations of BAPTA-AM for 6 and 24 h. Response was appreciated by a morphological features b cell viability (assessed by the percentage of cell viability with respect to number of viable cells at 0 h) c assessment of sub-G1 peak (24 h). Data are representative of three independent experiments

