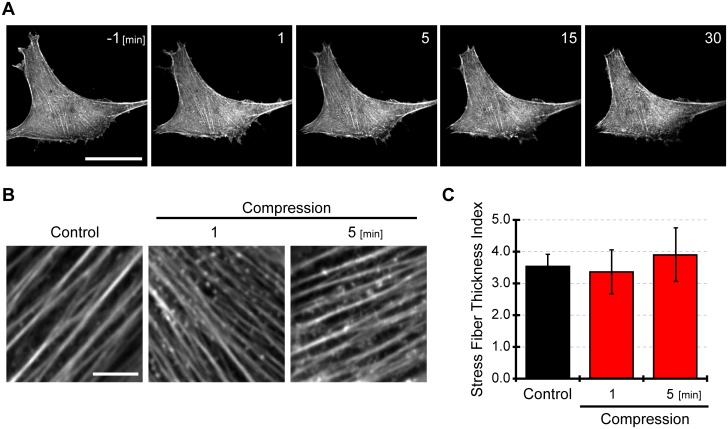
Fig 3. F-actin was unaffected by compressive stress.
(A) Live imaging of cells expressing azami green-actin under compressive loading. Numbers at upper right in images are relative time (min) from the onset of compressive loading. Scale bar is 50 μm. (B) Immunofluorescent imaging of F-actin in cells before and after induction of compression. We observed F-actin stained with MFP 488-phalloidin in cells before and after compressive strain. Scale bar is 5 μm. (C) Stress fiber thickness index in cells under compressive stress. By analyzing immunofluorescent images of F-actin, we assessed the thickness of F-actin in the form of stress fiber thickness index. The thicker actin filaments have a larger value of stress fiber thickness index. Image J software was used to estimate the thickness of F-actin. The stress fiber thickness index was calculated from 3 independent experiments including 60 individual cells. The results were presented as mean ± SEM.

