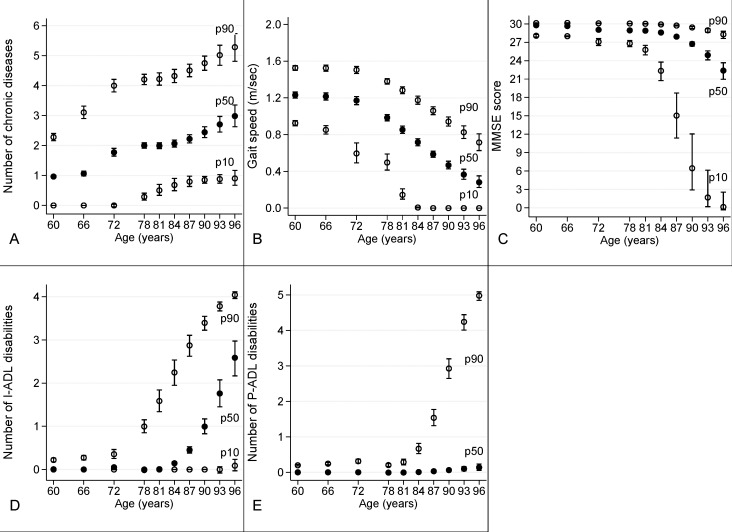
Fig 1. Distribution across age of A) number of chronic diseases; B) gait speed (m/sec); C) MMSE score; D) number of I-ADL disabilities; E) number of P-ADL disabilities.
10th percentile (p10, hollow circle), median (p50, full circle) and 90th percentile (p90, hollow circle) with relative 95% confidence intervals of the five health indicators adjusted by sex.

