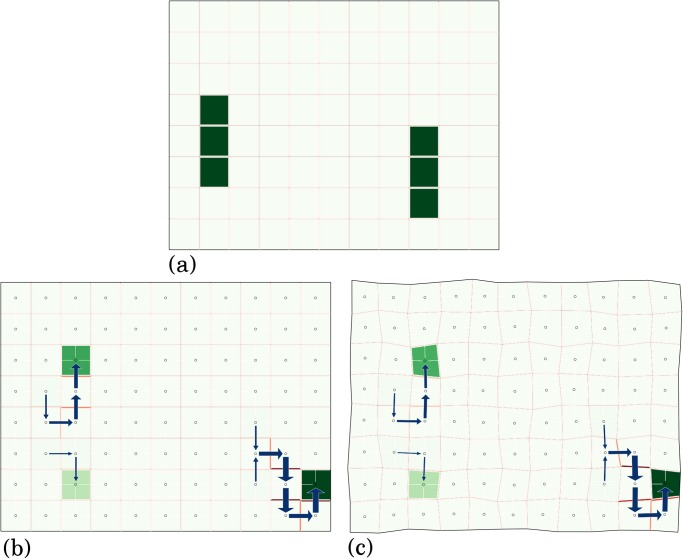
Fig 5. Steady state equilibrium in a simulation on a regular grid of cells with heterogeneous auxin production rates.
(a) Initial conditions using a grid of 88 cells where most cells have an auxin production rate except the two groups of 3 cells shown in darker green, where . (b) Using the production rates from (a) and parameters in every cell, one of the possible steady state solutions. Each cell is colored in green according to the auxin concentration a i (pale for the minimal concentration, dark green for the maximal). Cell membranes are colored according to the corresponding PIN concentration (with a red colormap). The flux J i → j is represented by a blue arrow of width proportional to ∣J i → j∣. (c) With parameters and initial conditions identical to those in (b) but with a diffusion coefficient D = 0.001 and a grid of non-regular cells.

