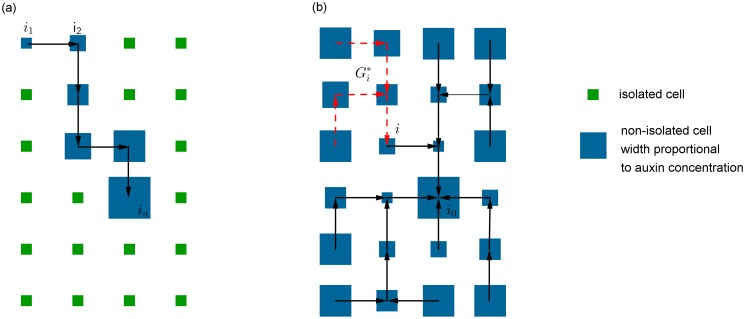
Fig 6. Schema illustrating source- and sink-driven vascular patterns when there is a single primordium i 0.
The sizes of the blue boxes represent auxin concentrations. In the left panel, the source i
0 creates a linear vein within which the auxin concentration increases; auxin concentrations within the vein are higher than the background auxin level (A). In the right panel, the patterning process leads to a directed spanning tree rooted at the unique sink i
0. The auxin concentration a
i inside each cell i is proportional to the inverse of the size of the sub-tree  of
of  rooted at i. Auxin concentrations thus decrease along the paths, leading to an auxin depleted zone in the neighbourhood of the sink i
0.

