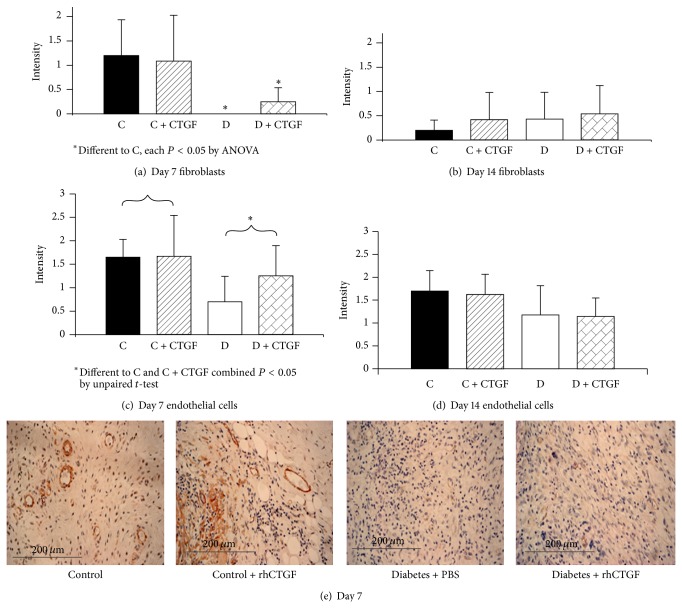
Figure 2.
Wound α-smooth muscle actin staining in fibroblasts and endothelial cells. (a) shows α-SMA staining intensity scoring in fibroblasts, in treated control animals compared with the two diabetic animal groups, at day 7; * P < 0.05 by ANOVA for each of the groups marked versus Control + CTGF. No such differences were observed at day 14 in (b). In (c) increased α-SMA staining in endothelial cells was observed at day 7 in control animals (treated and untreated combined) compared with diabetic animals (treated and untreated combined); * P < 0.05 by unpaired t-test. No such differences were observed at day 14 (d). Results are expressed as mean ± SEM. Representative images at day 7 are shown in (e).

