Figure 5.
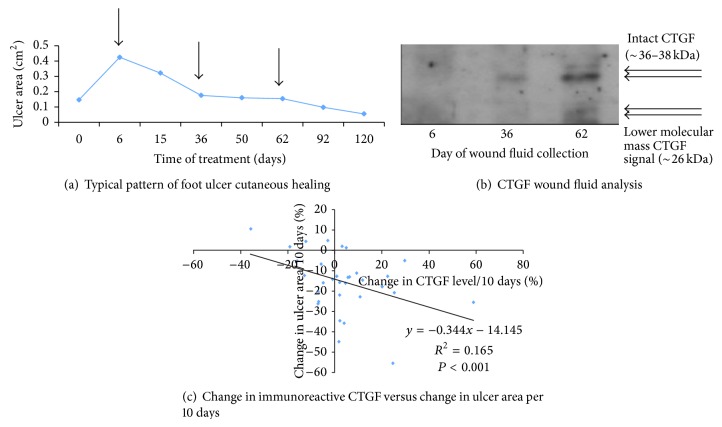
Endogenous ulcer fluid CTGF and diabetic foot ulcer healing. In (a) ulcer area versus time is shown for a typical small hallux plantar ulcer, with the arrows indicating sampling of postdebridement ulcer fluid. The ulcer fluid in (a) was analyzed by Western Immunoblot to detect CTGF immunoreactivity under nonreducing conditions, as shown in (b). Both intact monomeric CTGF and a lower molecular mass ~26 kDa CTGF are observed. Images such as those in Figure 5(b) were quantitated by densitometry, to compare change in ulcer fluid CTGF immunoreactivity versus change in ulcer area, each across 10 days. In (c), CTGF was found to increase as ulcer area reduced (R 2 = 0.165; P < 0.001).

