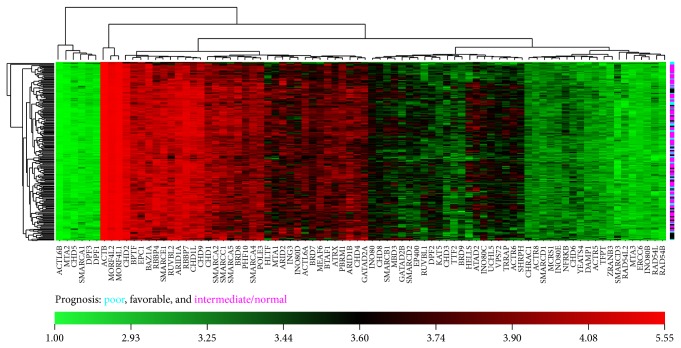
Figure 3.
Expression of CRCs in subtypes of AML patients. The gene expression data from 194 AML patients were mined for CRC subunits from the TCGA (The Cancer Genome Atlas) data portal (https://tcga-data.nci.nih.gov/tcga/). The expression values were log10 transformed, and hierarchal clustering and the heatmap were constructed using CIMminer. The colored bar on the right side of the heatmap indicates patients with a poor (blue), favorable (black), and intermediate/normal (pink) prognosis.

