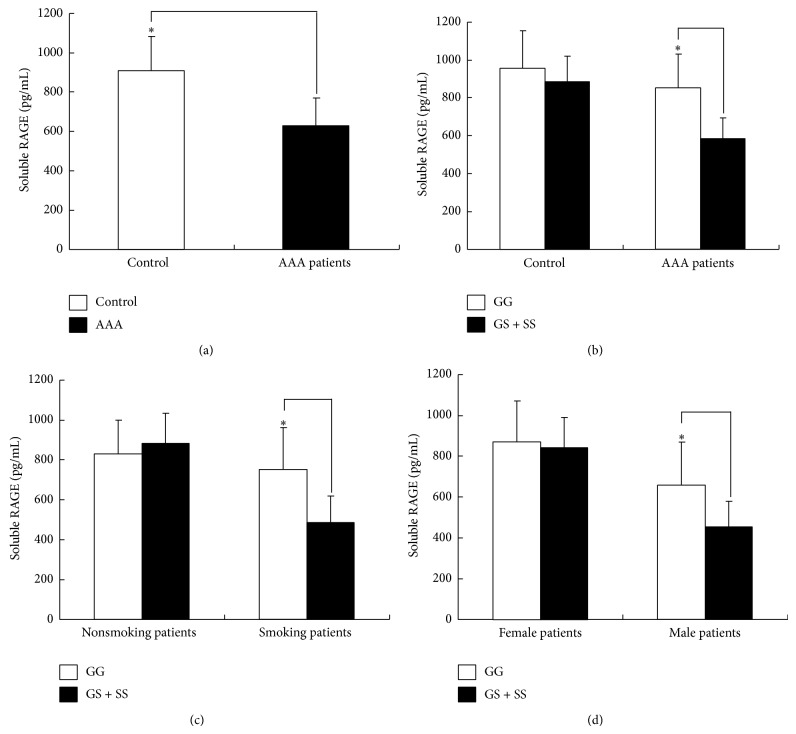
Figure 1.
(a) The serum sRAGE levels in the AAA patients (n = 80) and the controls (n = 80). The blank box and the black box represent the serum sRAGE levels in the controls and the AAA patients, respectively. * P = 0.035 when comparing the serum sRAGE levels between the AAA patients and the controls. (b) The serum sRAGE levels in the AAA patients and controls stratified according to the RAGE genotype. The blank box represents the 82GG genotype, and the black box represents the 82GS + 82SS genotype. * P = 0.025. (c) The serum sRAGE levels in the AAA patients stratified according to smoking status and the RAGE genotype. * P = 0.012. (d) The serum sRAGE levels in the AAA patients stratified according to gender and the RAGE genotype. * P = 0.036. The serum sRAGE levels in the RRMS patients and the healthy individuals were measured using ELISA. The data are shown as the mean ± SD. An asterisk indicates P < 0.05.

