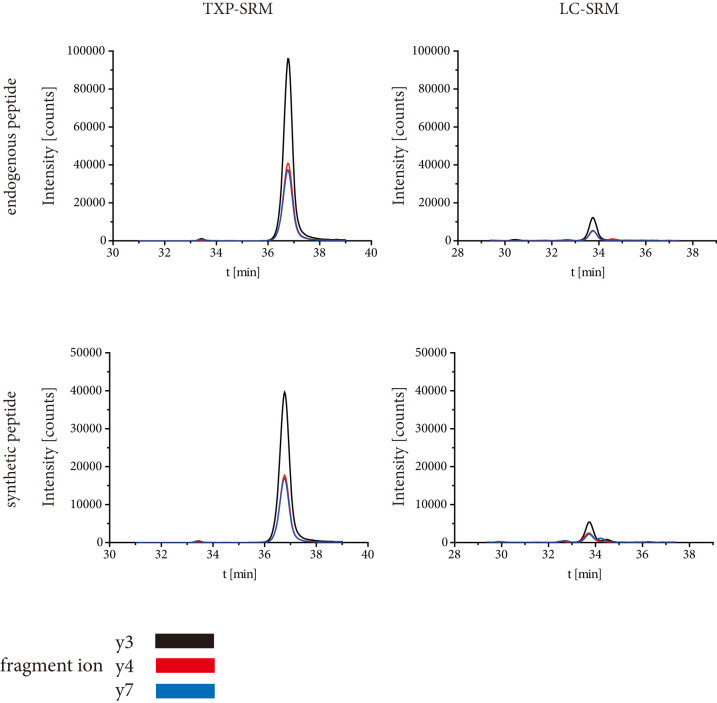
Figure 2. Comparison of signals of endogenous cytochrome P450 3A4/43, (b) 3A5, (c) 3A7, and (d) MDR-1 peptide and synthetic standard.
Ten μg hepatocyte protein extract was digested and spiked with 100 fmol synthetic standard. The samples were either analyzed by TXP-SRM or LC-SRM workflow. Ion chromatograms of the peptide fragments y3, y4 and y7 are shown.

