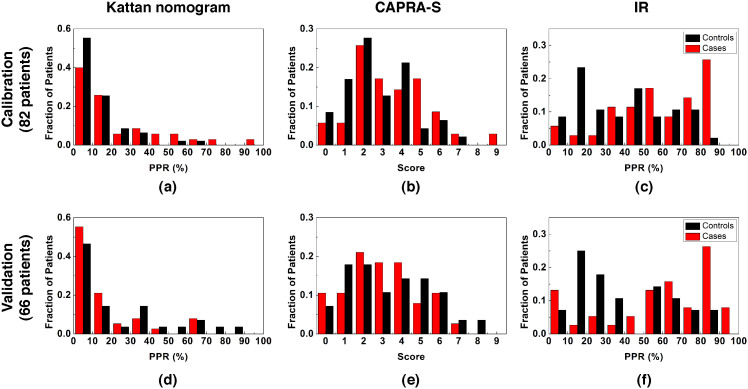
Figure 4. Score distribution.
Distribution of the recurrence cases (red) and non-recurrence controls (black) by (a)(d) Kattan (b)(e) CAPRA-S (c)(f) IR Scores. Distributions on (a)(b)(c) the calibration dataset and (d)(e)(f) the validation dataset are plotted. PPR represents the predicted probability of recurrence.

