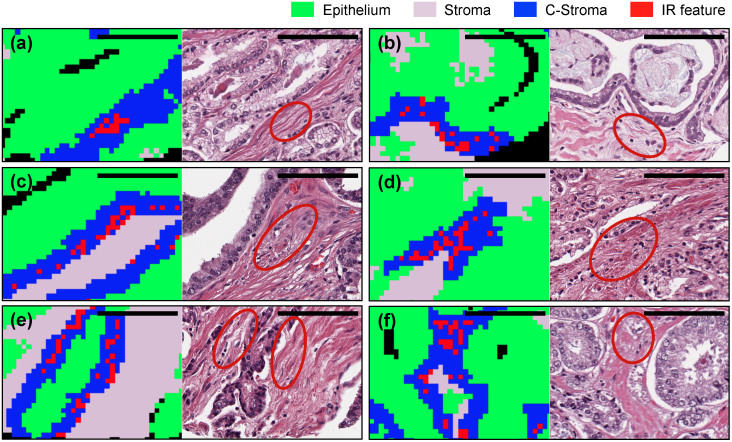
Figure 5. Comparison of IR and H&E images.
IR stromal features (red rectangles) and their corresponding areas (red circles) are marked on IR and H&E images, respectively. (a)(c)(e) Recurrence images and (b)(d)(f) non-recurrence images. C-Stroma represents stroma cells adjacent to cancer cells. Black scale bar denotes 100μm. IR features are related to (a)(b)(e)(f) loose or myxoid stroma, (b)(c)(d)(e)(f) fibroblasts, and (a)(d)(e)(f) retraction clefting.

