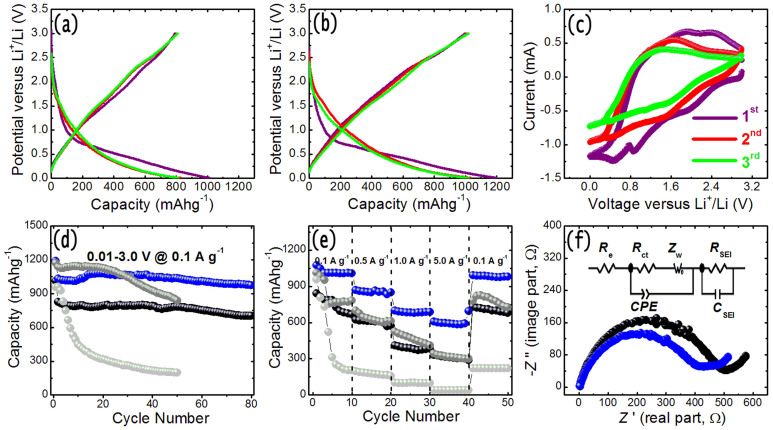
Figure 7.
Galvanostatic charge/discharge curves of (a) MoS2-NR and (b) MoS2-NR/rGO nanohybrids for the first three cycles at a rate of 0.1 Ag−1 in the voltage range of 0.01–3 V (versus Li+/Li) at room temperature. (c) Representative CVs for the first three cycles of MoS2-NR/rGO nanohybrids electrode between 0.01 and 3 V (versus Li+/Li) at a scan rate of 0.5 mVs−1. (d) Comparison of the cycling performance of MoS2-NR (black lines) and MoS2-NR/rGO nanohybrids (blue lines) at a rate of 0.1 Ag−1 in the voltage range of 0.01–3 V (versus Li+/Li) up to 80 cycles. (e) Rate capability of MoS2-NR (black lines) and MoS2-NR/rGO nanohybrids (blue lines) electrodes at various current rates between 0.1 Ag−1 and 5.0 Ag−1. The data for the cycling performance and rate capability of MoS2-NT (gray lines) and MoS2-NP (light gray lines) under the same testing conditions are shown for comparison (ref 37). (f) Nyquist plots of MoS2-NR (black lines) and MoS2-NR/rGO nanohybrids (blue lines) electrodes measured with an amplitude of 5 mV over the frequency range of 100 k Hz and 0.01 Hz. The inset shows the equivalent electrical circuit.

