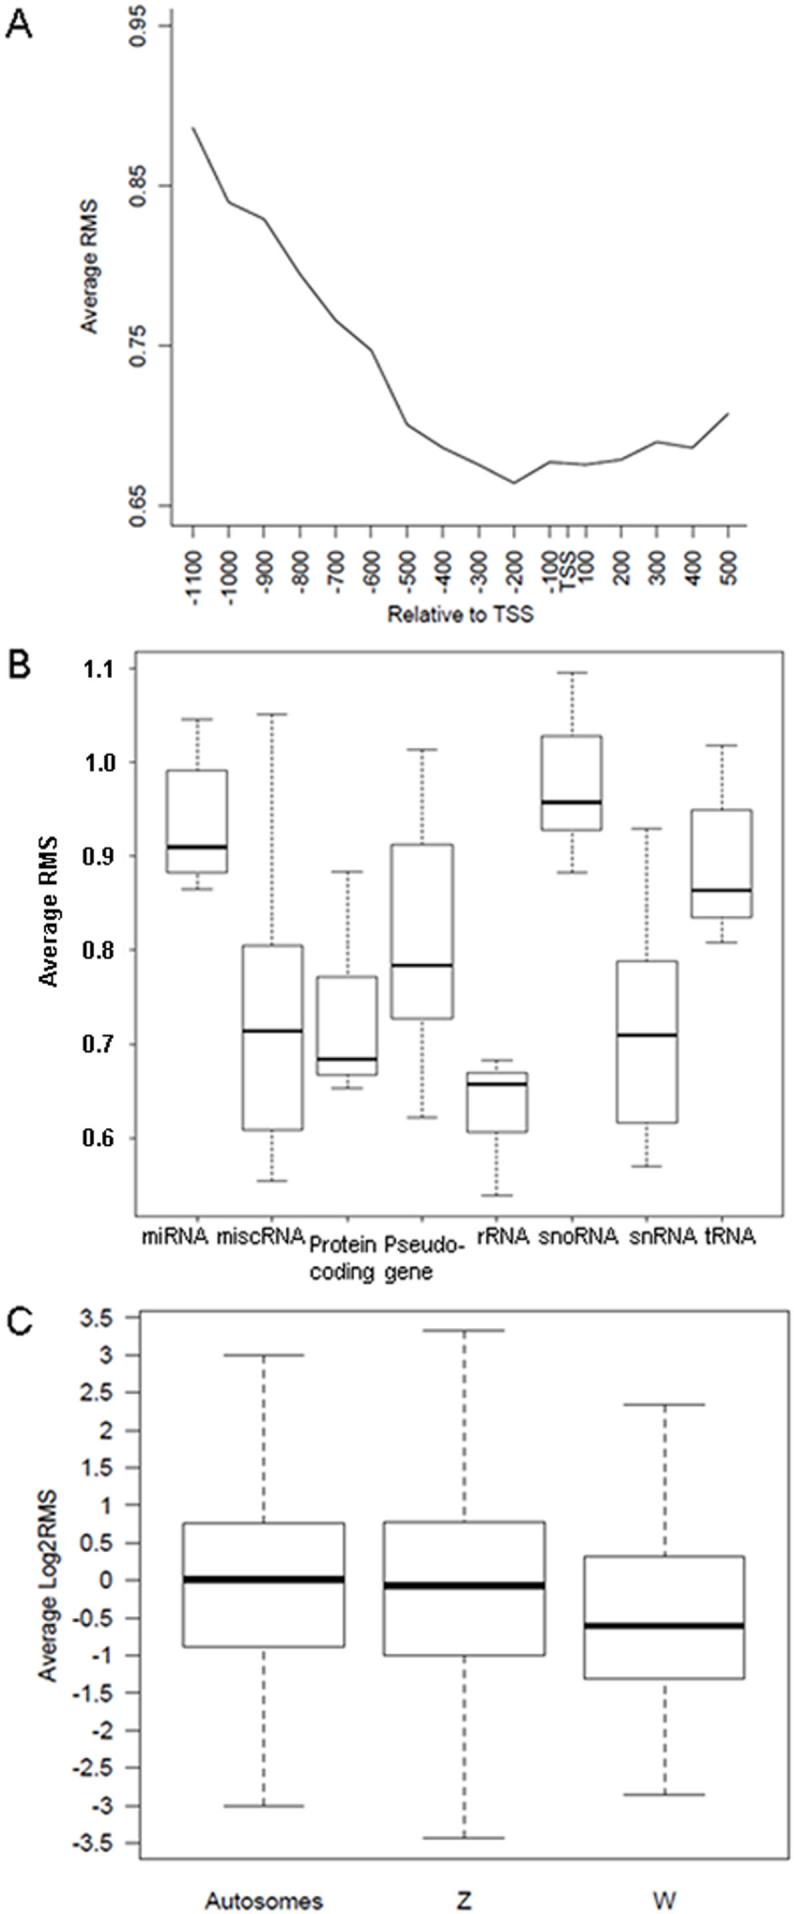
Figure 1. Characteristics of promoter DNA methylation in the chicken genome.

(A) Distribution of DNA methylation around the TSS in the chicken genome. (B) Average relative methylation level of different gene categories in the chicken genome. Box plots showing the methylation level distribution of each gene category. Gene methylation levels of 25–75% were selectively used and the middle line represents the average methylation level. (C) Relative DNA methylation levels of autosomes, and Z and W chromosomes.
