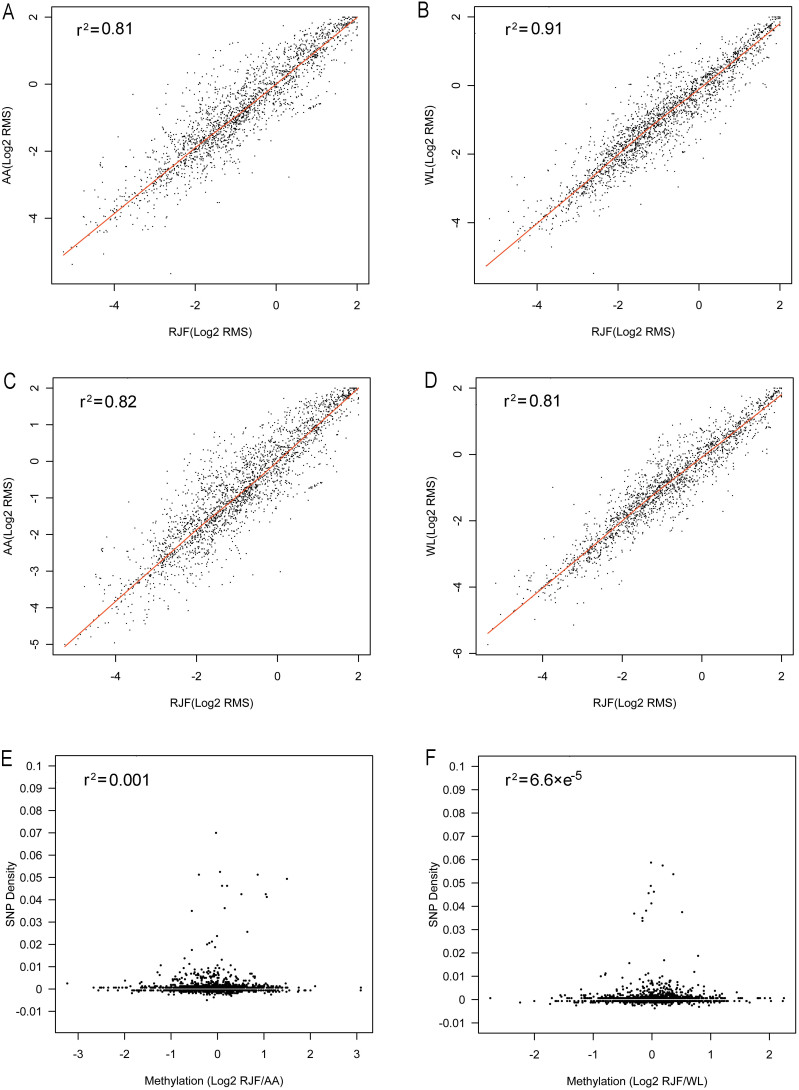
Figure 5. Effect of SNPs on DNA methylation level.
Scatter plots showing the correlation of the DNA methylation level of probes to SNP. Each plot represents an SNP site, x and y axis represent RMS of domestic and RJF of corresponding probe. Loss of CG motif: (A) RJF and AA; (B) RJF and WL. Gain of CG motif: (C) RJF and AA; (D) RJF and WL. SNP density and DNA methylation changes. (E) RJF and AA; (F) RJF and WL.

