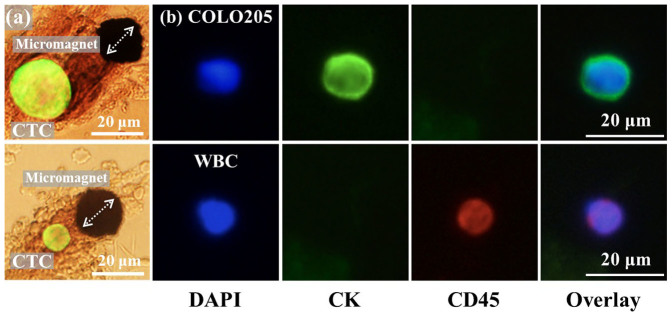
Figure 5. Immunomagnetic CTC screening experimental results.

(a) Observation of COLO205 cell being captured by the micromagnet with bright field microscope confirms the attractive interactions between CTCs and the micromagnet. The aggregation patterns of the magnetic nanoparticles can help estimate the direction of the magnetization of the micromagnets, as indicated by the arrows. (b) Fluorescent signal of the CTCs and WBCs of three dyes (DAPI, CK, CD45). CTCs are DAPI+, CK+ and CD45−, and WBCs are DAPI+, CK− and CD45+.
