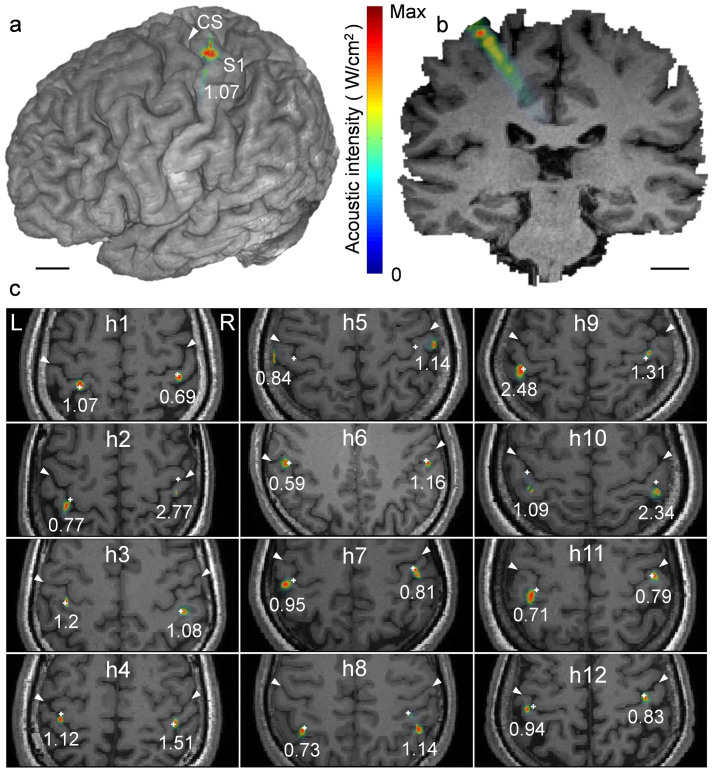
Figure 4. Simulated acoustic intensity profiles overlaid on the region of the hand primary somatosensory cortex.
The acoustic intensity profiles projected on (a) a 3D rendering and (b) a coronal section of the volumetric MRI data (from ‘h1'). The value, 1.07, indicates the maximum Isppa value (in W/cm2) at the focus. Scale bar, 1 cm. (c) The simulation results displayed on the axial view of each individual's anatomical MRI (‘h1' through ‘h12'; white arrows indicate the subject's central sulci; CS). The location of the intended FUS focus is marked with ‘+'. The numbers under each simulated focus indicate the maximum acoustic intensities (Isppa in W/cm2).

