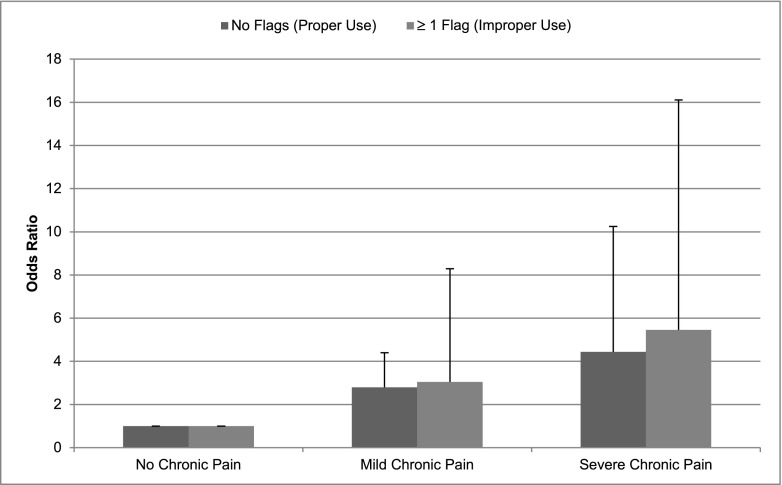
Figure 2.
The y axis exhibits the adjusted odds ratios of analgesic use, dosed properly or with a DRP (improper use) relative to no analgesics comparing participants with mild chronic pain to no pain (reference) (P=0.01 and P=0.03, for proper dosing or DRP, respectively) or severe chronic pain to no pain (P=0.001 and P=0.02, for proper dosing or DRP, respectively).

