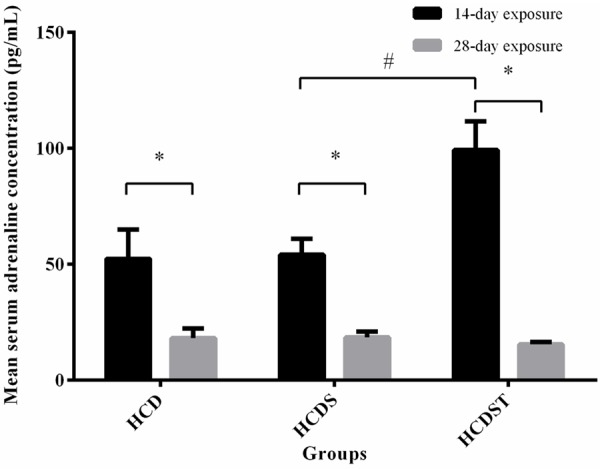
Figure 5.

Mean serum adrenaline concentrations (pg/mL) of rats in Groups HCD, HCDS and HCDST (Mean ± 1 SE, n=8) (*: P < 0.05 for comparisons between groups of 14- or 28-day exposure; #: P < 0.05 for comparisons within groups of 14- or 28-day exposure) (GA - Glycyrrhizic acid; HCD - High-calorie diet; HCDS - HCD + stress; HCDST - HCD + stress + 100 mg/kg GA).
