Figure 1.

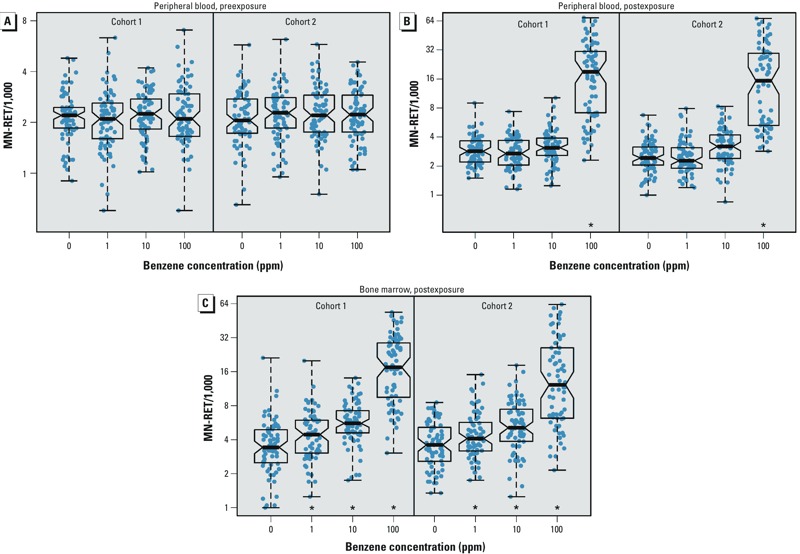
MN‑RET measurements were consistent between cohorts. (A) Preexposure blood MN‑RETs. Boxes represent the median and interquartile range, and whiskers cover the entire data range. (B) Postexposure blood MN‑RETs increased in the 100-ppm group. (C) Postexposure bone marrow MN‑RETs increased in a dose-dependent manner. *Approximately 1-unit increase in MN-RET/1,000 with each order of increase in benzene concentration.
