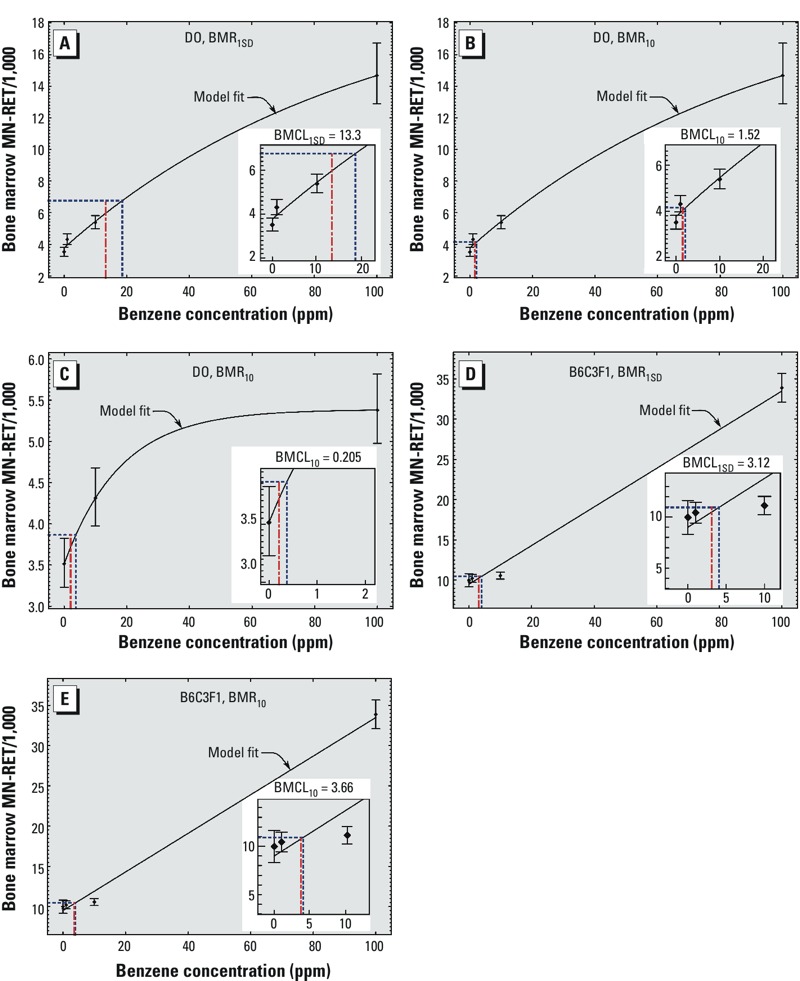
Figure 2.

BMC modeling of bone marrow MN‑RET in DO mice using the 0-, 1-, 10-, and 100-ppm exposure groups to estimate a BMR1SD (A) and a BMR10 (B). Values shown are the mean of each exposure group ± SE. Curved black lines represent the model fit, dashed blue lines represent the BMC, and red dot and dash lines indicate the BMCL. Insets show details of low concentration range. (C) BMC modeling of bone marrow MN‑RET in DO mice using the 0-, 1-, and 10-ppm exposure groups using a BMR10. BMC modeling of bone marrow PCE in B6C3F1 mice using a BMR1SD (D) and a BMR10 (E).
