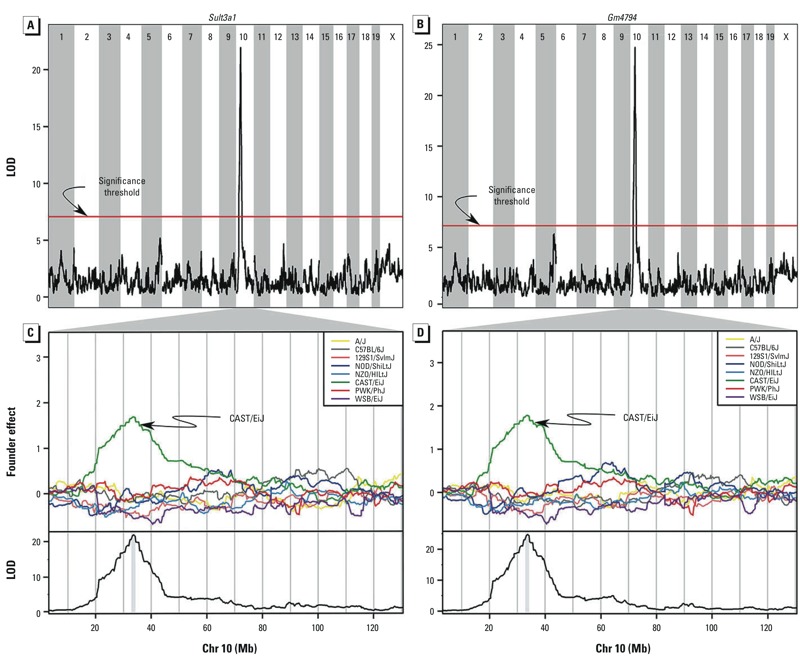
Figure 4.

Linkage mapping of liver Sult3a1 (A,C) and Gm4794 (B,D) expression revealed a QTL on Chr 10 in the same location as the MN‑RET QTL. (A,B) Plot of the LOD at each marker; the red line indicates the permutation-derived significance threshold of p = 0.05. (C,D) Plots of the effects of each of the eight DO founder alleles on Chr 10 (top) and plots of the LOD score on Chr 10 (bottom). The CAST allele (green) is associated with higher liver Sult3a1 and Gm4794 expression.
