Figure 8.
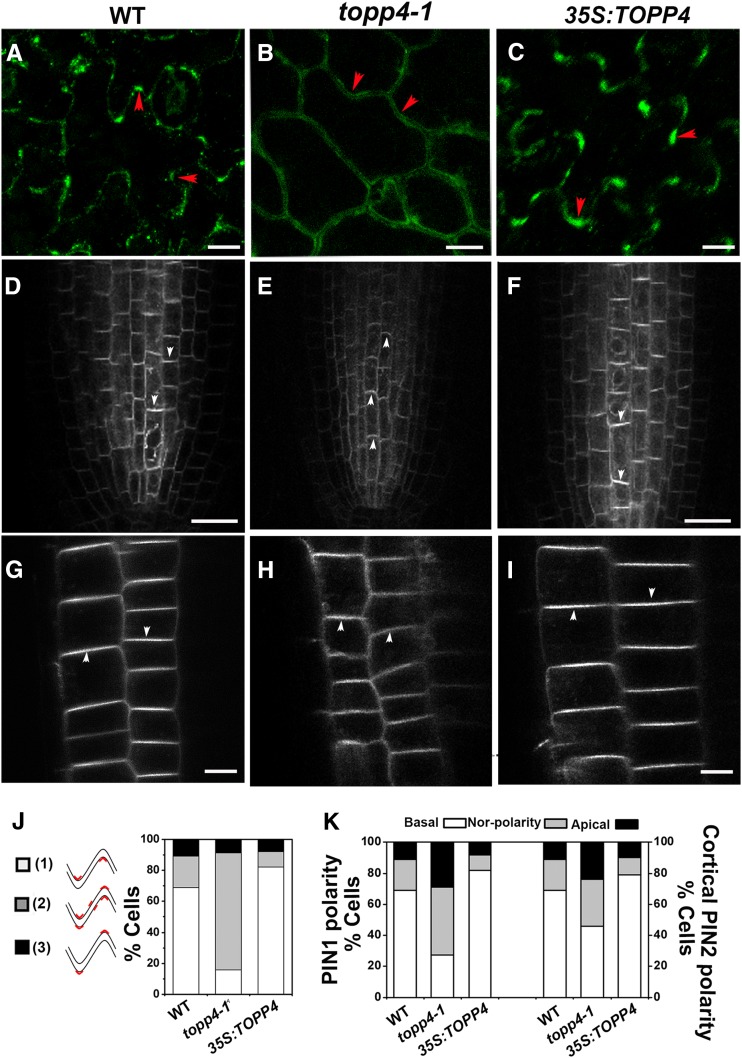
Polar localization of PIN1 and PIN2. A to C, Subcellular localization of PIN1 in PCs was detected by immunofluorescence with the anti-PIN1 antibody. Bars = 25 µm. Red arrowheads indicate the accumulation of PIN1 at lobe regions. D to I, Live images of GFP-tagged PIN1 (D–F) and PIN2 (G–I) in the roots. Bars = 50 µm. White arrowheads indicate polarity of PIN localization. J, Quantitative analysis of PIN1 localization patterns in PCs. 1, PIN1 preferentially localized only to lobe sides. 2, PIN1 localized to lobe and indentation sides or nonlobing regions. 3, PIN1 localized to indentation sides. The percentage of three types of PIN1 localization patterns of PCs is shown on the right. K, Quantification of PIN1 and PIN2 polarity defects in the roots. The PIN localization pattern was quantified from more than 30 randomly chosen cells. WT, Wild type.

