Figure 2.
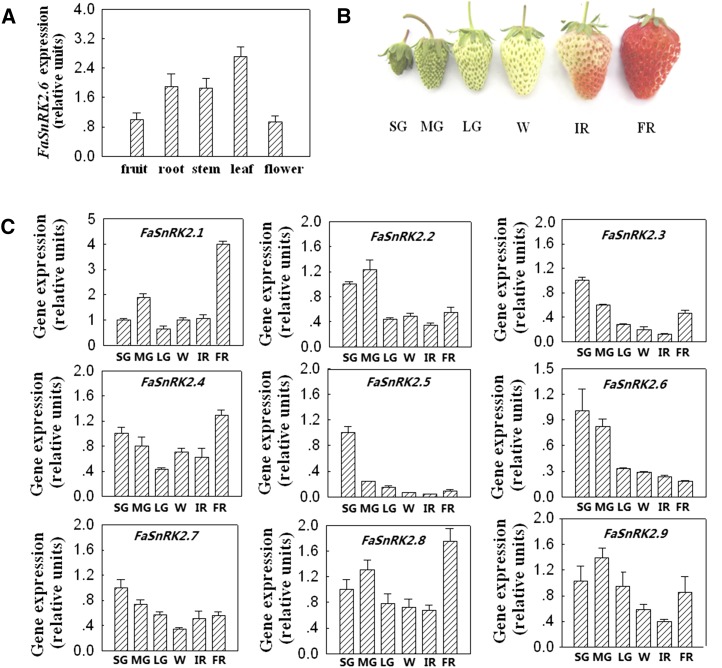
Temporospatial pattern of FaSnRK2 expression in strawberry fruits. A, Quantitative reverse transcription (qRT)-PCR analysis of FaSnRK2.6 expression in different organs of the strawberry plant. B, Phenotypes showing different developmental stages of strawberry fruit: SG, small green fruit; MG, middle green fruit; LG, large green fruit; W, white fruit; IR, initial reddening; and FR, full reddening. C, Quantitative PCR analysis of FaSnRK2 expression in different developmental stages of strawberry fruit. Labels below bars denote the corresponding developmental stages as explained in B. For A and C, qRT-PCR was conducted using FaACTIN as an internal control. Values are means + sd of five biological replicates.

