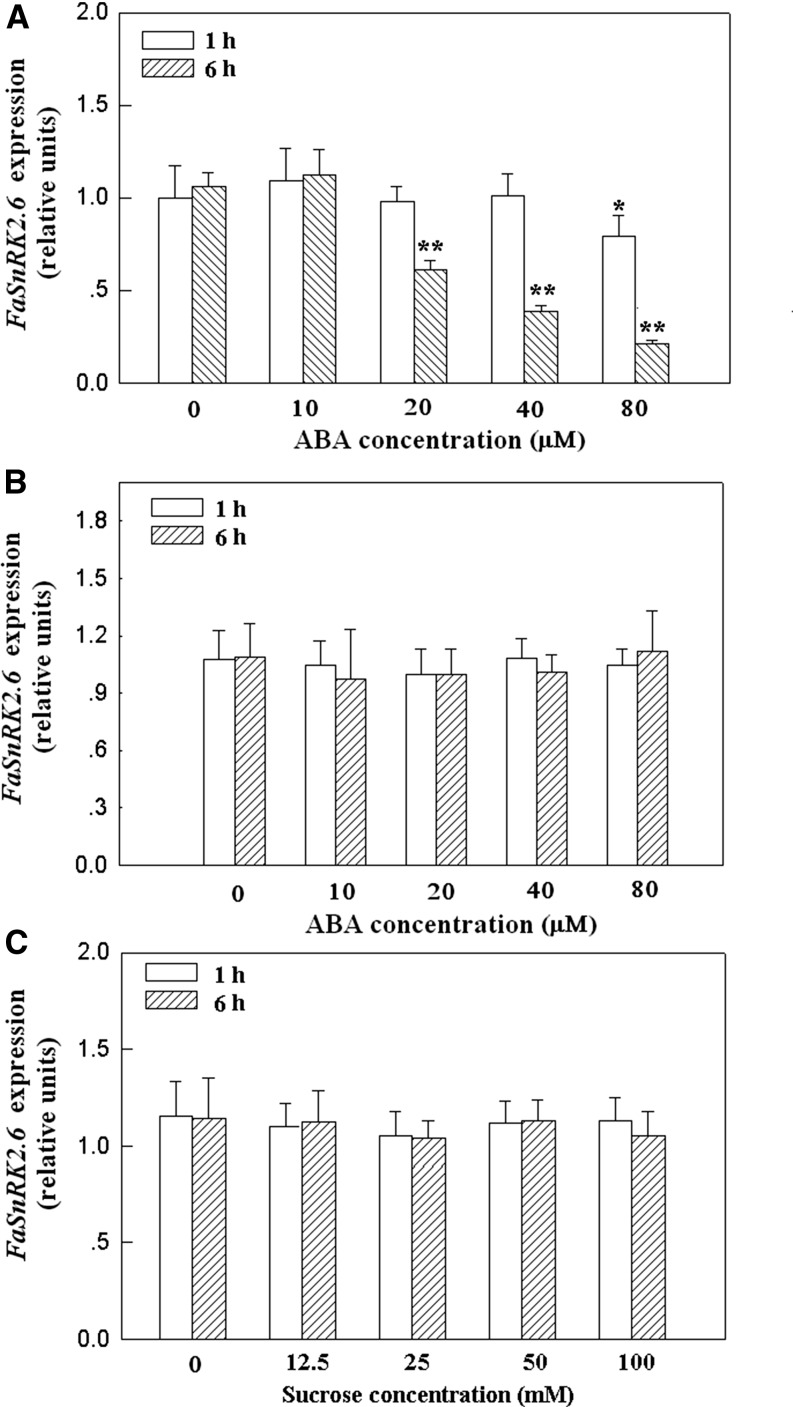
Figure 3.
qRT-PCR analysis of FaSnRK2.6 expression in response to ABA and Suc treatments in fruits and leaves. A, FaSnRK2.6 expression in response to ABA in fruits. Detached fruits in the large green fruit substage (i.e. corresponding to 18 DPA) were treated with various concentrations of ABA for 1 or 6 h, and then FaSnRK2.6 expression was examined. B, FaSnRK2.6 expression in response to ABA treatment in leaves. Young, fully expanded leaves were treated with various concentrations of ABA for 1 or 6 h, and then the FaSnRK2.6 expression level was examined. C, FaSnRK2.6 expression in response to Suc treatment in fruits. Detached fruits in the large green fruit substage were treated with various concentrations of Suc for 1 or 6 h, and then the FaSnRK2.6 expression level was examined. qRT-PCR was conducted using FaACTIN as an internal control. Values are means + sd of four biological replicates. Asterisks denote significant differences compared with the control sample (i.e. the 0 concentration) at *P < 0.05 and **P < 0.01, according to Student’s t test.

