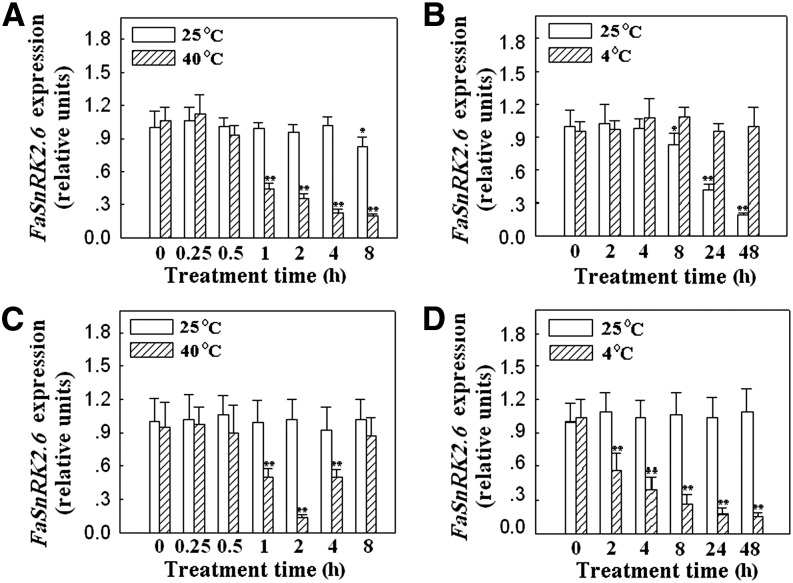
Figure 8.
FaSnRK2.6 expression in response to temperature treatments in fruits and leaves. A and B, Fruits were detached at the large green fruit substage (corresponding to 18 DPA) and then treated with high (40°C) or low (4°C) temperature for the indicated periods of time. Samples were then subjected to qRT-PCR analysis to evaluate FaSnRK2.6 expression. For high-temperature treatment (A), the fruit samples were incubated at 40°C for 0 to 8 h, and for low-temperature treatment (B), the fruit samples were treated at 4°C for 0 to 48 h. C, High-temperature treatment in leaves. D, Low-temperature treatment in leaves. For C and D, young, fully expanded leaves were used, and the method for temperature treatment was the same as described in A and B. qRT-PCR was conducted using FaACTIN as an internal control. Values are means + sd of three biological replicates. Asterisks denote significant differences at *P < 0.05 and **P < 0.01, using Student’s t test, as compared with the control sample (i.e. 0 h, 25°C).

