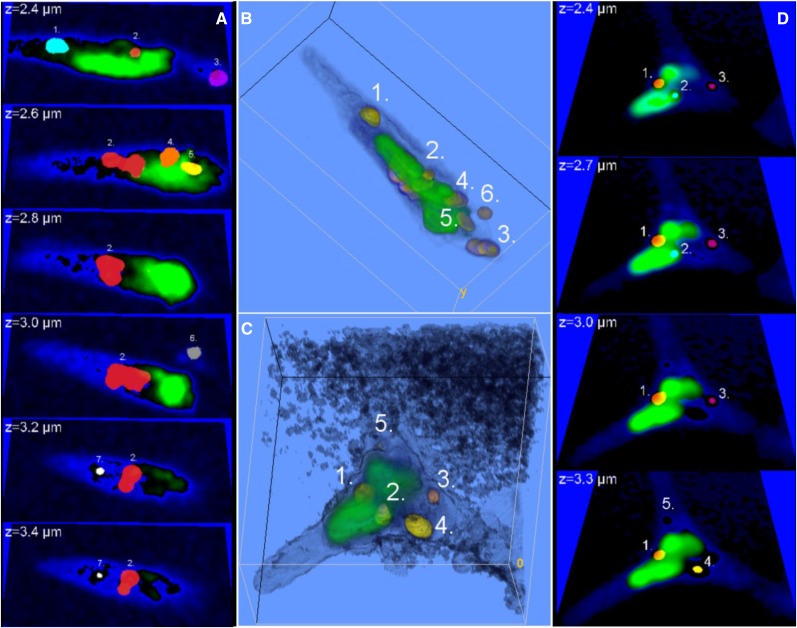
Figure 2.
3D information on the lipid droplet distribution in fusiform and triradiate cells grown under Ctrl conditions for 159 h. Lipid droplets are identified and counted by the ImageJ 3D object counter. Object count maps (A and D; each lipid droplet is color coded in cyan, red, magenta, orange, or yellow and numbered throughout the z-stack) are overlaid on the cell soma (blue) and chromophore (green) images at depths spanning throughout the cells. The images span areas of 15.6 × 9.1 µm2 (A) and 12.3 × 12.9 µm2 (D). The volumes of the individual lipid droplets range between 0.01 and 1.8 µm3 (approximately 0.005–1.6 pg), and the total lipid volumes are 2.6 µm3 in A and 1.2 µm3 in D (approximately 2.3 and 1.1 pg). The corresponding 3D renderings are shown in B and C. They reveal that most lipid droplets are located in the vicinity of the chloroplasts. The patchy pattern in C originates from the nonresonant CARS signal from the medium, as also can be noted in D.

