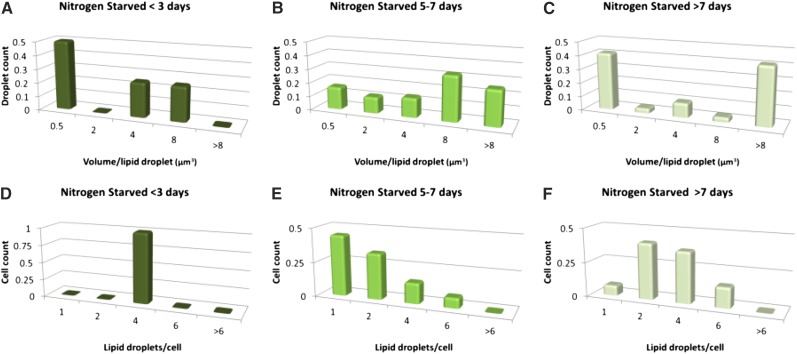
Figure 5.
Histograms showing the lipid droplet volume distributions (A–C) and droplet count distributions (D–F) for NS algae during exponential (A and D), early stationary (B and E), and later stationary (C and F) phases. They illustrate the shift from many submicron-sized droplets per cell (A and D) to a few larger droplets (B and E) when entering the stationary phase as a result of droplet fusion. Small lipid droplets continue to form, observed as a dual droplet population in C.

