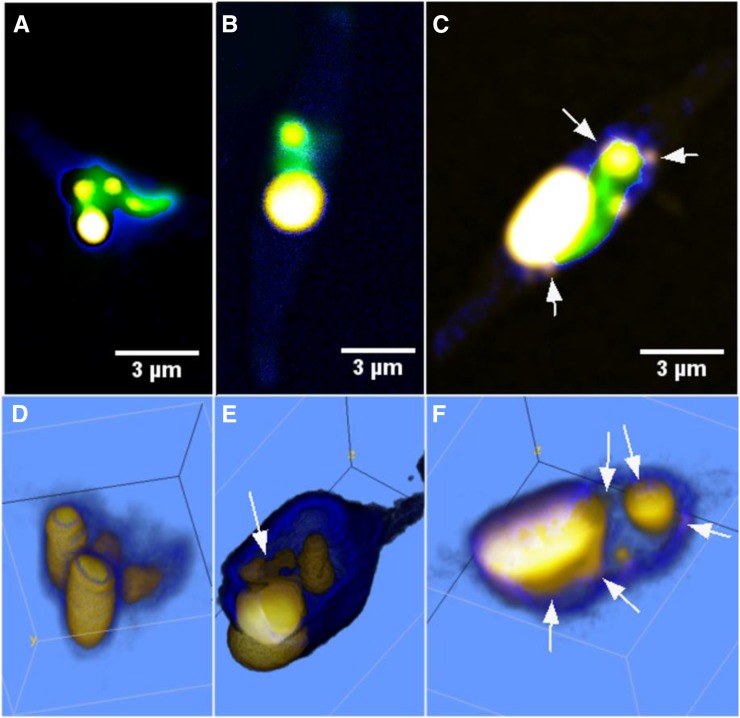
Figure 6.
CARS (lipid droplets: high-density C-H signal, yellow; cell soma: low-density C-H signal, blue) and TPE fluorescence (green) overlay microscopy images of the lipid accumulation and morphology of NS cells after 1 d (A; exponential phase), 6 d (B; stationary phase), and 8 d (C; late stationary phase) of culturing. Corresponding volume renderings are shown in D to F. Images illustrate the phenomena described in Figures 3C and 5: many, smaller lipid droplets already present in the exponential phase (four lipid droplets in the range 0.07–4.1 µm3) fusing into fewer and larger lipid droplets in the stationary phase (two droplets of 1.3 and 7.8 µm3). Note the lipid droplets docking to the already oversized droplet in E. The volumes of these docking droplets are included in the volume count of the main droplet, as they start to coalesce and could not be reliably segmented. After 1 week during the late stationary phase, the cells typically host one giant lipid droplet surrounded by docking and satellite lipid droplets, as indicated by the arrows in C and F. The volume of the giant lipid droplet here is 20.1 µm3. The color coding of the CARS signal was optimized to distinguish the weaker emission from the smaller, docking lipid droplets. The color-code transfer function of the low-thresholded CARS signal in the volume rendering in E was set to 3D fill mode in order to highlight the weak cell soma signal in contrast to the two-dimensional gradient mode used in the other images.

