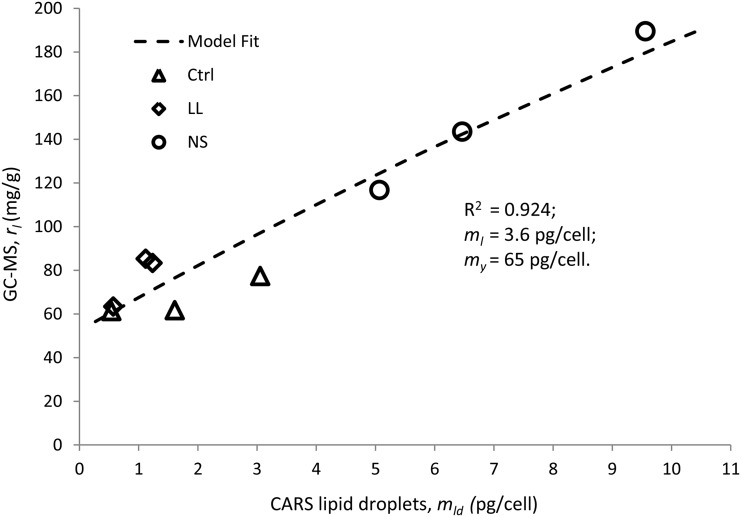
Figure 7.
Comparison of lipid amounts obtained from C-H CARS microscopy and GC-MS data. The good correlation indicates that the lipid droplets are responsible for the primary change in intracellular lipid content. Symbols represent experimental data of three repeated experiments for each growth condition: Ctrl, triangles; LL, diamonds; and NS, circles. The weight of lipids per cell was calculated on the assumption that the density of the lipid droplets is 0.9 g mL−1. The model (dashed line) assumes constant dry content per cell (my; excluding lipids) and dry content of nondroplet lipids (ml).

