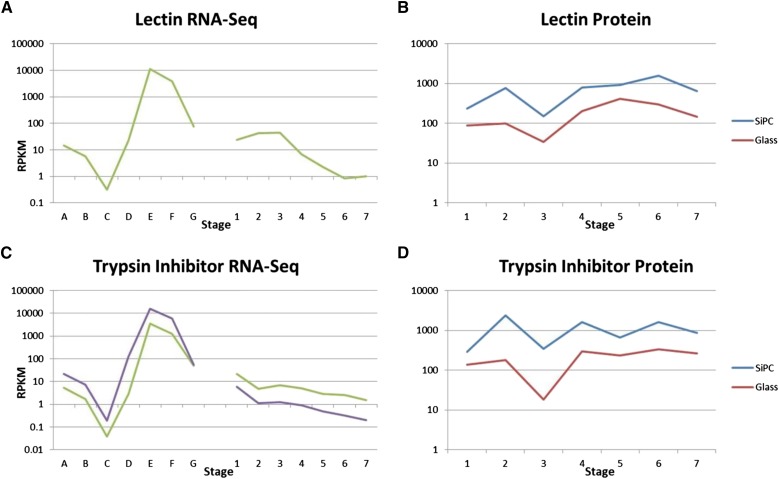
Figure 6.
Developmental gene expression and protein abundance data for two storage proteins. All graphs are log scale. RNA-Seq data (A and C) in RPKMs on the y axis show gene expression at seven stages of immature seeds (A–G) and seven stages of seedling cotyledons (1–7). Multiple lines indicate data from multiple gene models. Protein array data (B and D) show protein abundance at seven stages of seedling cotyledons for both silicon-substrate PC slides (SiPCs; blue) and glass slides (red). A data point of 0.001 indicates that the protein was undetected at that stage. All protein data are shown on log scale. Numbers 1 to 7 are seedling cotyledon stages as described in Figure 2 and the text. Stages on the x axis are defined as A to G. A, 4 DAF; B, 12 to 14 DAF; C, 22 to 24 DAF; D, 5- to 6-mg whole seeds; E, 100- to 200-mg cotyledon; F, 400- to 500-mg cotyledon; G, dry mature seeds.

