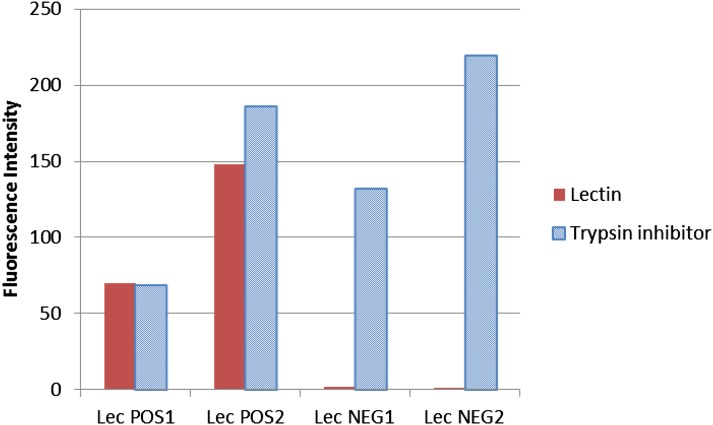
Figure 7.
Differential detection on silicon-substrate PC slides of trypsin inhibitor and lectin proteins in lectin-positive and -negative isolines. Histogram showing relative fluorescence levels representing either lectin (red) or trypsin inhibitor (blue) in dry seed from soybean lines with normal lectin levels (Lec POS) or no lectin (Lec NEG). Two slides (technical replicates) are shown for each soybean line. Lectin is the average of eight spots per slide, and trypsin inhibitor is the average of four spots per slide; average slide background and negative controls were subtracted out, and zero and negative values were transformed to 0.001.

