Figure 2.
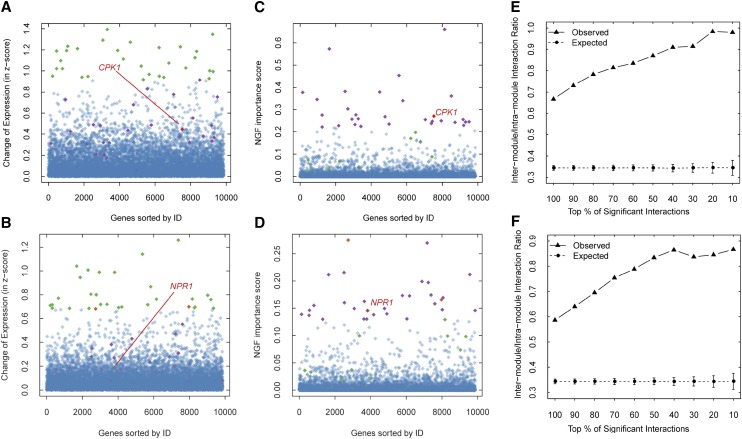
Comparison of NGF with differential expression analysis and characterization of the topological properties of significantly important gene interactions. A, Change (absolute value) of gene expression in the PTI group. B, Change (absolute value) of gene expression in the ETI group. C, NGF ISs of genes in the PTI group. D, NGF ISs of genes in the ETI group. The top 30 DEGs (green) and the top 30 genes with the highest NGF ISs (purple) are shown. The genes included in the top 30 genes of both the DEGs and the NGF results are indicated in orange. Overall, the top 30 genes ranked by NGF tend to be differentially expressed, but some immune-related genes even with moderate expression alterations, such as CPK1 and NPR1 (red), are also discriminated from the noisy background as a top 30 gene by NGF. The genes are ordered along the x axis according to their Arabidopsis Genome Initiative (AGI) numbers. In both the PTI (E) and ETI (F) groups, the significantly important gene interactions identified by NGF tend to link different network modules. This phenomenon is more obvious when the IS cutoff is increased.

