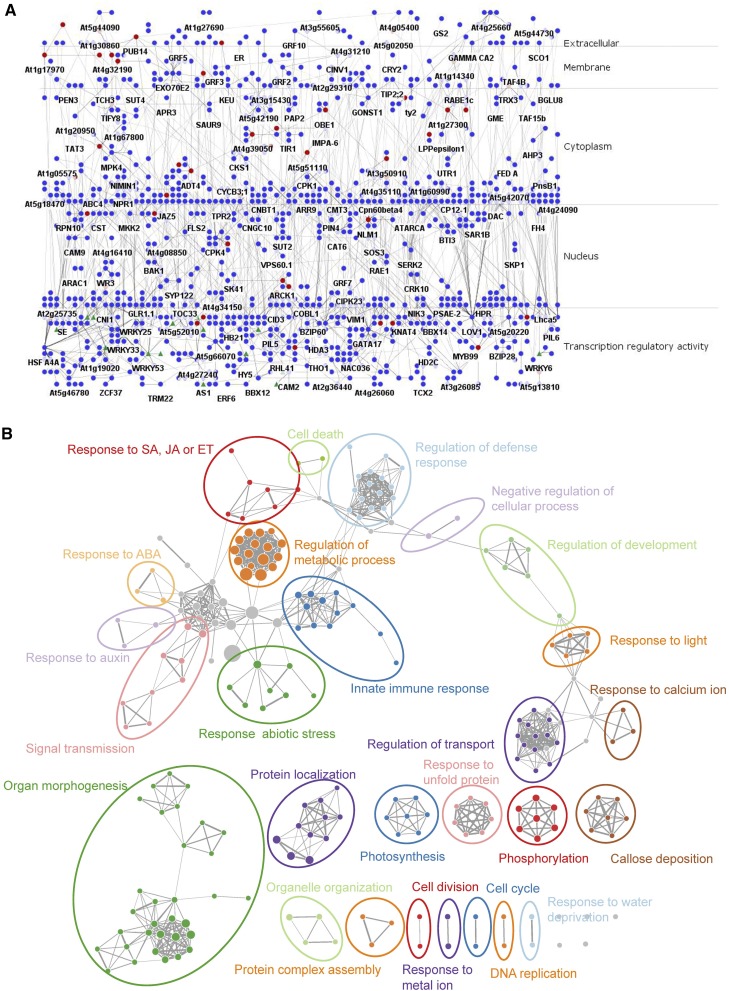
Figure 3.
The shared subnetwork between PTI and ETI. A, The subnetwork is arranged in traditional pathway style using the Cerebral plugin according to the confirmed subcellular location information of gene products from SUBA3. Forty-nine putative effector targets (red) are enriched in this subnetwork (P = 6.44 × 10⁻¹⁵, hypergeometric test), and 19 WRKY family TFs (green triangles) are included. B, Enrichment map of the shared subnetwork. Each node represents a gene set corresponding to a GO term enriched in the shared subnetwork, and each weighted edge represents the overlap between two gene sets. The node size is proportional to the number of genes that belong to this GO term. The width of the edge is proportional to the size of the overlapping gene sets. ET, Ethylene; ABA, abscisic acid.

