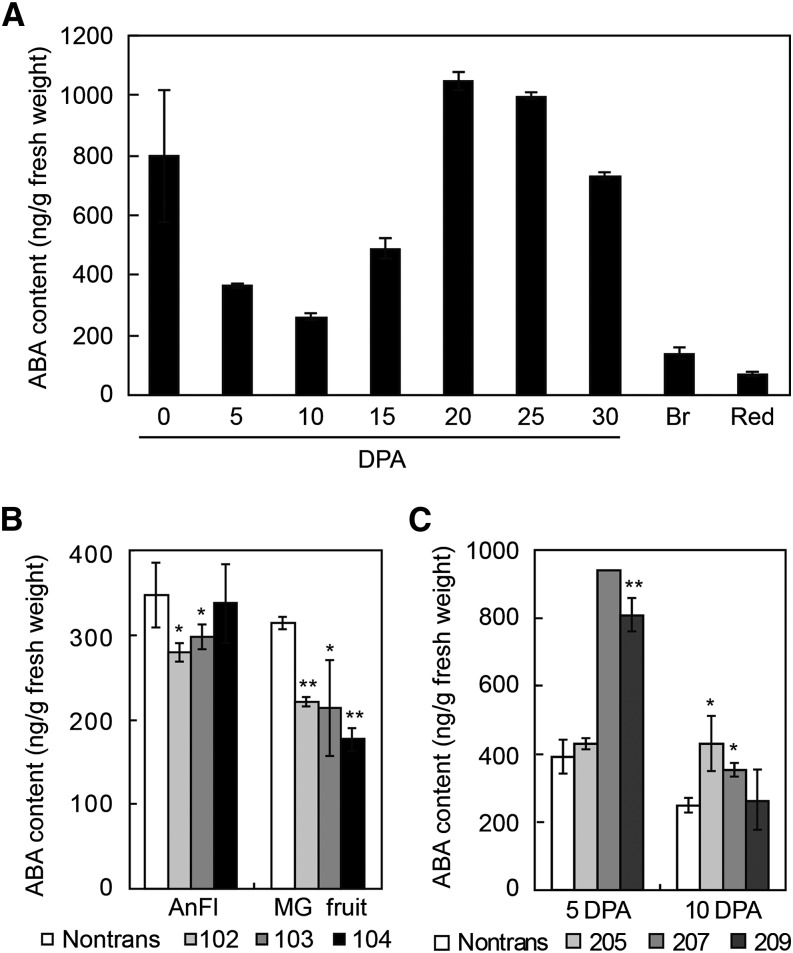
Figure 5.
ABA levels in SlZFP2 overexpression and RNAi lines. A, Dynamic changes of ABA levels in the fruits of LA1589 after anthesis. Red, Red ripe. B, ABA levels in anthesis flowers (AnFl) and MG fruits from three HA-SlZFP2 overexpression lines and their nontransgenic siblings (Nontrans). C, ABA levels in the fruits at 5 and 10 DPA of three SlZFP2 RNAi lines and nontransgenic siblings. The three HA-SlZFP2 overexpression lines used for ABA measurements were homozygous T2 plants, while the three RNAi lines were T2 heterozygous plants. Three biological replicates were conducted, except for the measurement in the 5-DPA fruits of the RNAi line 207, which was done on the pooled samples from three replicates due to few fruits being obtained. Data represent means ± sd. Statistical significance was based on Student’s t test: *, P < 0.05; and **, P < 0.01.

