Figure 4.
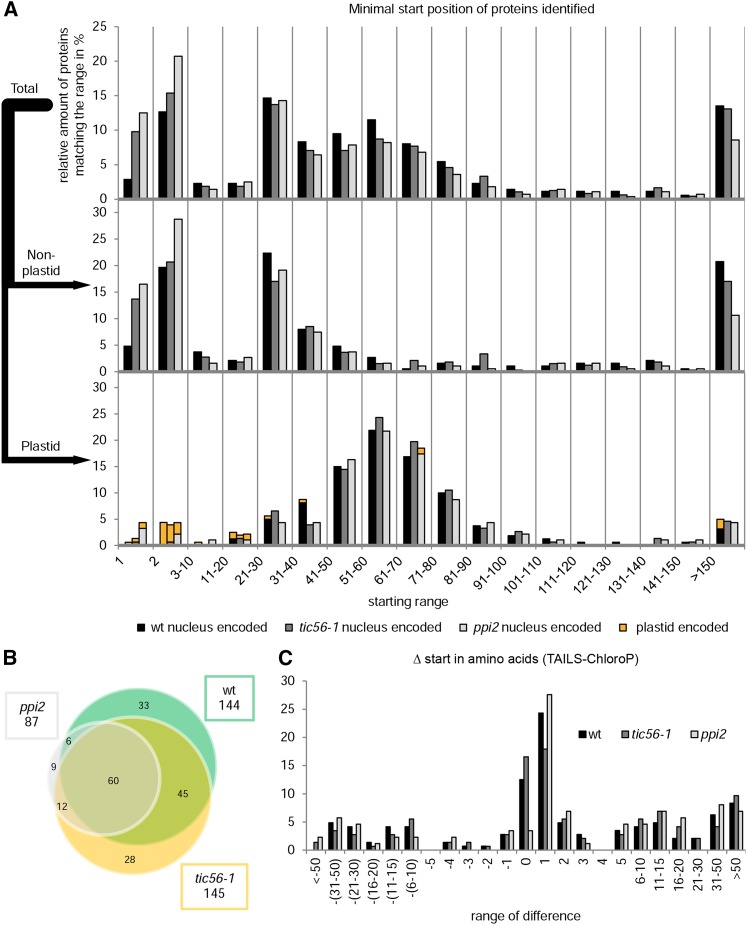
TAILS analyses of tic56-1, ppi2, and the wild type. A, Distribution of the minimal starting positions in the annotated full-length sequences of proteins identified by TAILS. For each identified protein, the most N-terminal peptide identified by the TAILS experiment was determined and grouped into starting ranges as indicated. The amount of proteins falling into a distinct range was set into relation with the total number of proteins of each plant line. In the graph at top, the minimal starting positions of all proteins identified are shown. The middle and bottom graphs show the distribution of starting positions of nonplastid or plastid proteins, respectively. The key at the bottom includes additional information about where the proteins are encoded (nucleus, black, dark gray, and light gray; plastid, orange). The first bar in each group always represents the wild type (wt), the second bar always represents tic56-1, and the third bar always represents ppi2. Chloroplast proteins were classified according to a chloroplast reference proteome (van Wijk and Baginsky, 2011). B, Venn diagram of nucleus-encoded plastid proteins identified for tic56-1, ppi2, and the wild type. C, The difference between the experimental (TAILS) and predicted (ChloroP) starting positions of the proteins was calculated. Positive values signify processing downstream, and negative values signify processing upstream of the theoretical processing site.

