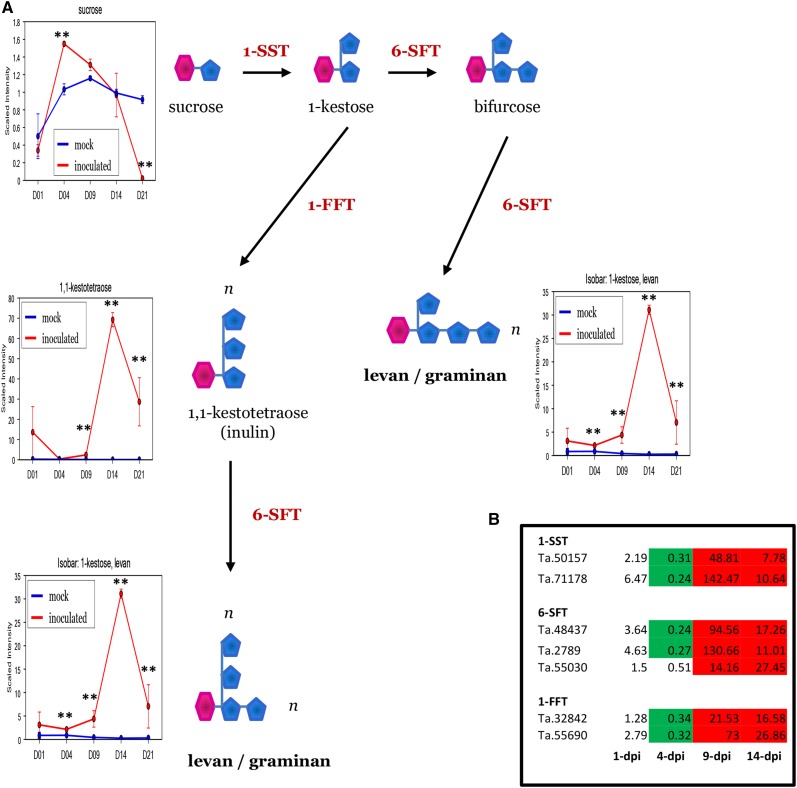
Figure 11.
The fructan biosynthesis pathway and fructan metabolite accumulation are triggered in wheat leaves during the onset of disease symptoms induced by Z. tritici. A, Quantification of fructan metabolites during the course of infection. **, Significant at adjusted P < 0.05. B, Transcriptional up-regulation of the fructan biosynthetic pathway. Green shading indicates significant down-regulation (adjusted P < 0.05), while red shading indicates up-regulation (adjusted P < 0.05).

