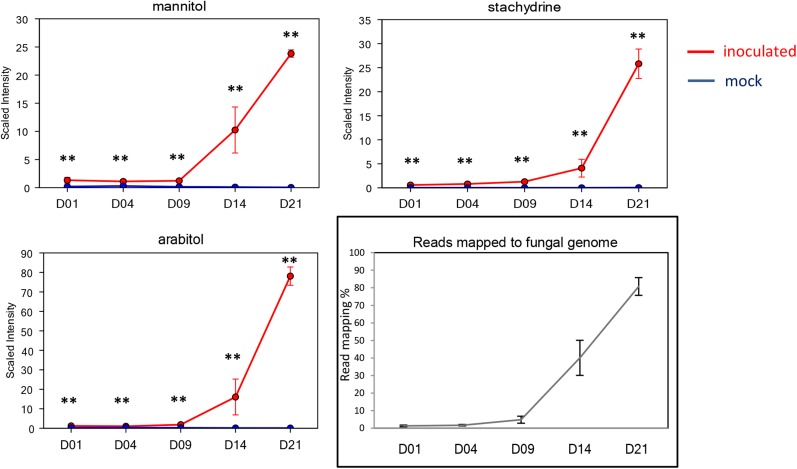
Figure 2.
Abundant fungal metabolite accumulation and RNAseq read mapping to the fungal genome chart the progress of disease. Red lines represent Z. tritici-infected leaves. Blue lines represent mock-treated leaves. Asterisks indicate significant increases at adjusted P < 0.05.

