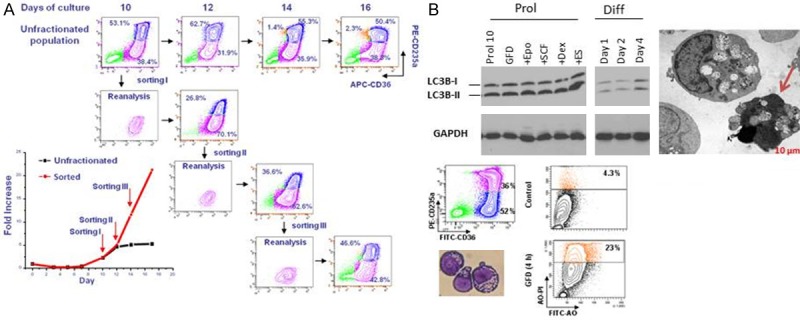
Figure 5.

Erys generated in HEMA culture have the ability to undergo self-replication and to die by autophagy. A: Phenotype (CD235a/CD36 flow charts) and growth curve (in fold increase, FI, bottom panel on the left) of Erys generated in HEMA over time by unfractionated populations (flow charts in the top) or by proErys (CD36posCD235aneg, in pink) separated by serial sorting every two days (see also [103]). Mature Erys (CD36posCD235apos) are indicated in blue. This serial sorting/culture approach is the “culture” equivalent of serial transplantation experiments performed in mice to determine the self-replication potential of stem cells. The growth curve of unfractionated populations reaches a plateau by day 10. By contrast, the growth curve of resorted proErys remains exponential upon three sorting given the ability of sorted cells to generate new proErys, in addition to Erys (reproduced from [103] and published by permission from the editor. B: Biochemical, electron microscopy and flow cytometric evidence for activation of the autophagic machinery in Erys obtained in culture with Dex. Autophagy is a proteosome-dependent pathway developed by eukaryotic cells to survive starvation but which may lead to death [100,101] or, in the case of EBs, may promote terminal maturation [98]. One of the first steps of this pathway is formation of the autophagosome with the conversion by lipidation of the cytosolic form of the microtubule associated protein light chain 3 (LC3-I) into the vescicle-specific LC3-II form. The fusion of the autophagosome with the lysosome involves release of LC3-II from the membrane. The autophagosome machinery is mature when the ratio between LC3-1/LC3-II [100,101] is 1:2. Biochemical analyses (top panels on the left): By westen blot, Erys from the proliferative phase (Prol) express a LC3-I/LC3-II ratio of 1:2, an indication that the cells contain mature autophagosomes. This ratio is not further increased by growth factor deprivation (GFD), 15 min stimulation with EPO, SCF. Dex or estradiol (ES) or 1, 2 and 4 days exposure to EPO to induce their maturation (differentiation culture, Diff) [28]. Electron microscopy observations (Top panel on the right). Cultured Erys contain autophasomic vescicles detectable by electron microscopy. The arrow indicates an Ery presenting features of death in the process to extrude its autophagosomic vescicles. Flow cytometry observations. By flow cytometry, autophagic death is detected by acrydin orange (AO) staining. At day 10, only 4% of Erys are AOpos but the frequency of AOpos Erys increases up to 23% upon growth factor deprivation (GFD). Modified from [103] and published by permission from the editor.
