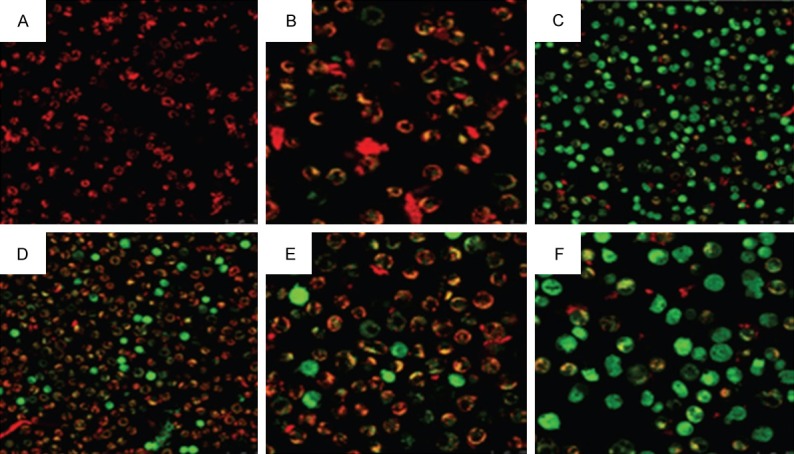
Figure 7.

Evaluation of mitochondrial membrane potential of A-549 cells analyzed by laser confocal microscopy and flow cytometry after treatment with 25 μM Isorhamnetin (IR, B), 0.5 μM cisplatin (CP, C), 0.5 μM carboplatin (CB, D), IR+CP (E) and IR+CB (F). The ratio of red and green mean fluorescence intensity obtained under FACS shows mitochondrial membrane potential loss induced by isorhamnetin, cis-platin, carboplatin and their combinations.
