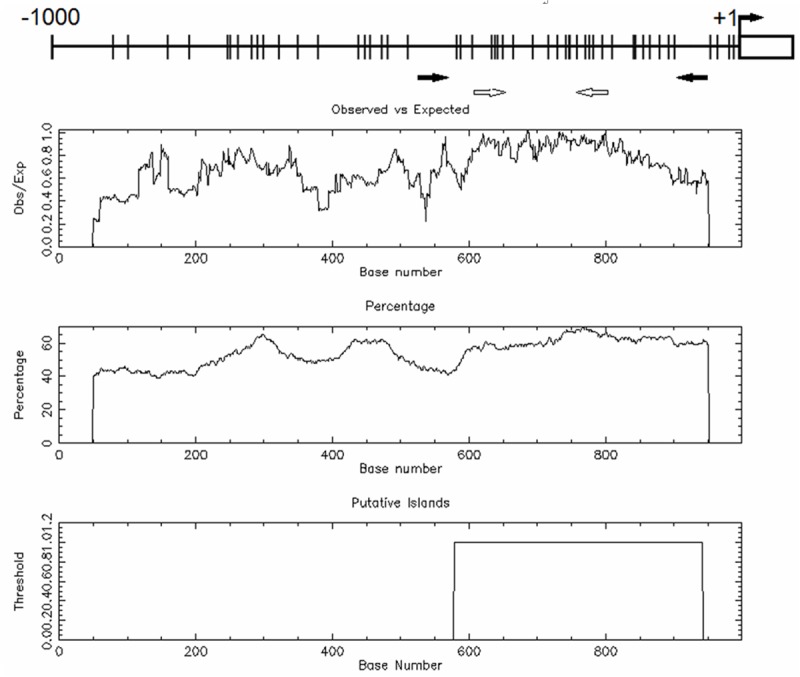
Figure 1.

Bioinformatics analysis of MOK promoter on chromosome 14. The vertical lines on the top horizontal line indicate the cytosine resides of CpGs. Numbers in the top panel represent nucleotide positions from MOK translating initial codon. Turning black arrow indicates the translating initial codon of MOK gene; the straight black arrows indicate the locations of primers used for bisulfite sequencing analysis, and the blank arrows indicate the locations of primers used for RQ-MSP analysis. Second panel represents the distribution of observed/expected ratios of CpG dinucleotides; third panel plots the GC content as a percentage of the total; bottom panel represents the putative CpG island within the -1.0 kb of analyzed sequence.
