
Figure 2.
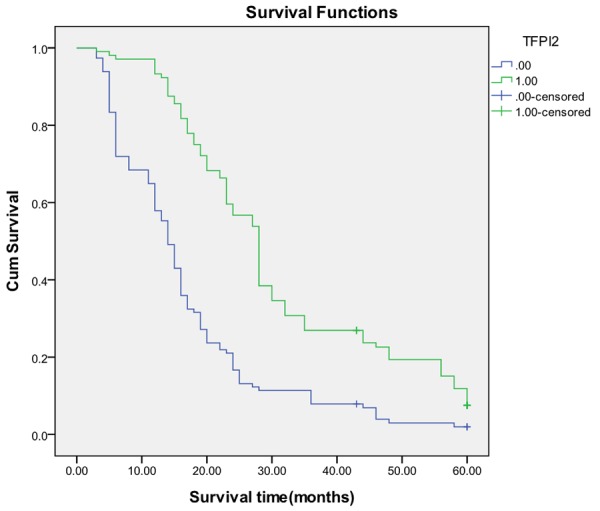
Kaplan-Meier survival analysis by TFPI-2 status (n = 218). The y-axis represents the percentage of patients; the x-axis, their survival in months. The green line represents TFPI-2- high expressive patients with a trend of better survival than the blue line representing TFPI-2- low expressive patients (Log rank = 45.149; P = 0.0001). Mean overall survival (OS) time was 31.1 months for the TFPI-2-high expressive group and 16.8 months for the TFPI-2- low expressive group.