
Figure 3.
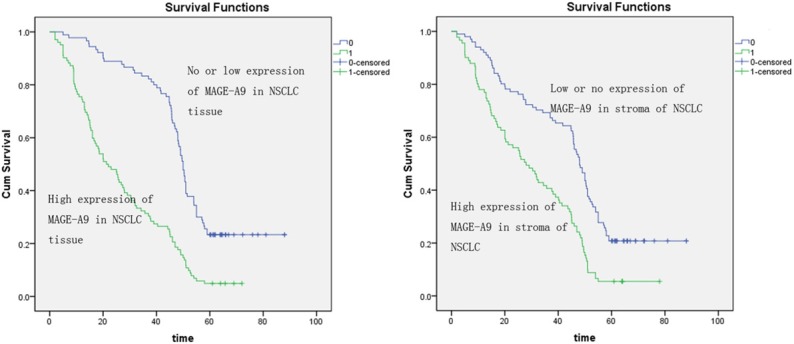
The Kaplan-Meier analysis was used for investigation of the relationship between clinicopathologic factors and overall survival of non-small cell lung cancer (NSCLC) patients. Curves show the calculation of MAGE-A9 expression in NSCLC tissues with the Kaplane-Meier method. A. The high expression of the MAGE-A9 high expression group (green line) has significantly less survival than the low expression of the MAGE-A9 low expression group (blue line). B. The curves show the calculation of MAGE-A9 expression in the stroma of NSCLC with the Kaplane-Meier method. The high expression of the MAGE-A9 high expression in the stroma of NSCLC group (blue line) has significantly less survival than the low expression of the MAGE-A9 low expression in stroma of NSCLC group (green line).