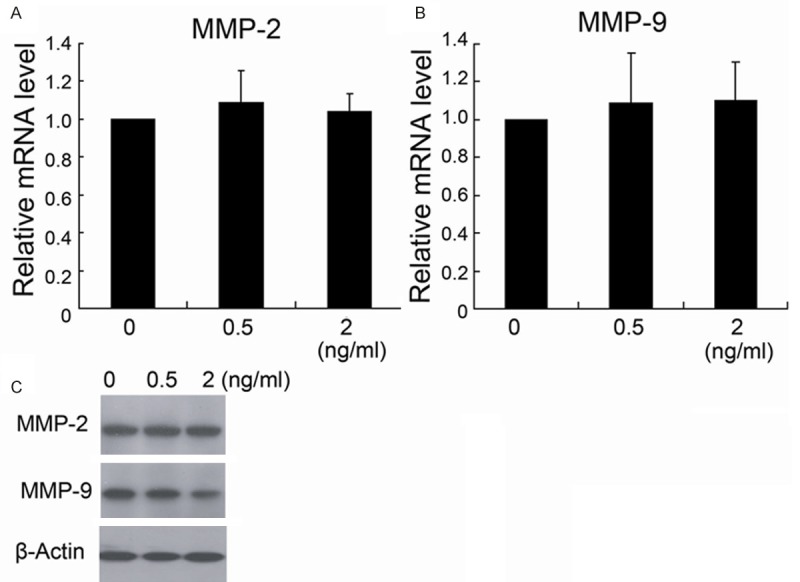
Figure 5.

The effect of fentanyl on MMP-2 and MMP-9 expression of HCT116 cells. HCT116 cells were treated with different concentrations (0 ng/ml, 0.5 ng/ml and 2 ng/ml) of fentanyl for 24 hours. MMP-2 and MMP-9 expression were detected by real-time PCR (A, B) and Western blotting (C). *P < 0.05 by Student’s t-test, indicates a significant difference from the group without fentanyl treatment. All experiments were repeated three times.
