Abstract
Recently, more and more studies show that long non-coding RNAs (lncRNAs) play a very important role in various biological processes. However, research on lncRNA in the tumor cell drug resistance of it is seldom reported. In this study, gemcitabine-resistant pancreatic cancer cell line SWl990/GZ was obtained by treating parental cell line SWl990 in vitro with increasing dosage of gemcitabine in culture medium intermittently for ten months. We identified4983 of 13310 detected lncRNAs demonstrated > 2-fold abnormally expressed in response to the gemcitabine-resistant, among of them, 1993 and 2990 lncRNAs were upregulated and downregulated. Meanwhile, 4759 mRNAs exhibited at least a 2-fold, of these, 2671 and 2088 mRNAs were upregulated and downregulated. Gene Ontology analysis and Pathway analysis revealed that differential expression mRNA involved in significant biological regulatory function and some genes may be particular to pancreatic cancer chemotherapy resistance. Quantitative real time PCR confirmed the changes of six lncRNAs (RP11-58D2.1, lincRNA-ZNF532, AP000221.1, CTC-338M12.5, CR619813, DDX6P) and nine mRNAs (SYT1, FAM171B, ZNF331, FAM187B, CYP1A1, SRXN1, HIST1H2BL, TOMM40L and SPP1) in SW1990 and SW1990/GZ. We also found that the upregulating of gemcitabine on the expression of lincRNA-ZNF532 was time-dependent. Gemcitabine at a range from 1.0 μM to 16.0 μM induced a increase of lincRNA-ZNF532 in SW1990 cells. The relative level of DDX6P is opposite to that of lincRNA-ZNF53 in the same circumstance. In conclusion, the dysregulated lncRNAs and mRNAs identified in this work may represent good candidates for future diagnostic or prognostic biomarkers and therapeutic targets.
Keywords: Pancreatic cancer, drug-resistant, lncRNA, mRNA, expression profle
Introduction
Pancreatic cancer (PC) is the fourth leading cause of cancer death in the last two decades, with a less than 6% five-year survival rate and a median overall survival of < 6 months, and incidence rates are close to mortality rates, which is also known as “the king of cancers” [1]. PC is one of the most lethal malignancies with poor prognosis due to advanced stage disease at initial diagnosis, tumour relapse and the absence of treatment strategies that specifically and effectively target these tumors [2]. The only curative treatment is surgical resection but this surgery is possible in only 10% to 15% of cases [3]. For locally advanced, unresectable and metastatic disease,chemotherapy is considered the main treatment option, but the dismal prognosis is partly due to its Intrinsic and acquired resistance characteristics. Gemcitabine (2’, 2’-difluorodeoxycitidine) is a nucleoside analog and a pyrimidine antimetabolite that inhibits deoxyribonucleic acid (DNA) synthesis by inhibition of DNA polymerase and ribonucleotide reductase [4]. It is considered to be the first-line therapy drug for pancreatic cancer. But its therapeutic efficacy is far from satisfactory because there are many cases resistant to gemcitabine. Clinical data shows that therapeutic benefits were experienced by only 23.8% of gemcitabine-treated patients in their early stages of treatment [5]. Thus, a better understanding the molecular mechanisms underlying the development of chemoresistance would promote our understanding of PC development and treatment failure [6]. Pancreatic cancer will still to be a main unsolved health problem in the 21(st) century.
Mechanisms of resistance to gemcitabine is very complicated and previous studies from genome transcription and translation level failed to illustrate this problem deeply. We need a new angle to explain the mechanism of pancreatic cancer chemotherapy resistance. The emergence of long non-coding RNAs (lncRNAs) bring us a novel way to research in the tumor cell drug resistance. In 2002, lncRNAs were discovered via large-scale sequencing of full-length cDNA libraries in the mouse [7]. Since 2007, a large number of tumor-associated lncRNAs were found, setting off a wave of lncRNA studies. Except for about 2% protein-coding genes, the vast majority of the human genomes are non-coding RNAs (ncRNAs), such as microRNAs (miRNAs, 21-25 nt), smallinterfering RNAs (siRNAs, 21-25 nt) and piwi-associated RNAs (piRNAs, 24-33 nt) were elucidated first, and then lncRNAs were reported more recently [8-10]. LncRNAs are transcribed from intergenic and intronic regions in human genome by RNA polymerase II (RNA P II), which lengths from 200 nt to ~100 kilobases (kb) lacking significant proteincoding open reading frames (ORFs) [11] and their biological functions have been reported, for instance, DNA damage repair, epigenetic control, transcription regulation, pre and post-translational regulation, cell cycle, survival, migration, metabolism and differentiation control and even governing the apoptosis process [10,12]. Deregulation of lncRNAs has been proposed to be associated with pancreatic cancer, such as HOTAIR, MEG3, H19, MALAT1 and GAS5 [13-17]. However, lncRNA research just at the starting stage, study on lncRNA and its function and regulation mechanism are just the tip of the iceberg, research on lncRNA in the tumor cell drug resistance of it is seldom reported. The aim of this work was to explore the expression profile of lncRNAs and mRNAs in gemcitabine-resistant SW1990/GZ cells compared with that in parental SW1990 cells. These results may provide novel insights of drug resistance in lncRNA level and potential therapeutic targets for management of gemcitabine resistance in cancer patients [18].
Materials and methods
Cell culture
Human pancreatic cancer cell line SW1990 was purchased from the cell bank of the Shanghai Branch of the Chinese Academy of Sciences. The human gemcitabine-resistant pancreatic cancer cell line SWl990/GZ was obtained by treating parental cell line SWl990 in vitro with increasing dosage of gemcitabine in culture medium intermittently for ten months. SW1990 and SW1990/GZ were cultured in DMEM (Gibco, Breda, The Netherlands) with 10% foetal bovine serum (FBS) (Gibco)in a humid atmosphere containing 5% CO2 at 37°C. Gemcitabine was purchased from LILLY France, dissolved in DMSO as stocksolution at concentration of 20 mM. The cells were passaged at a ratio of 1:2~3 every 4~5 days. Cells in the logarithmic phase of growth were used for all experiments.
In vitro drug sensitivity assay
Cells in the exponential phase of growth were seeded in 96-well plates (5 × 10³ cells/well) and incubated overnight at 37°C. After the cells had adhered to the plates, the cells were incubated with different concentrations of gemcitabine for 48 h at 37°C. Additionally, we should set up not add cells only add DMEM (control group) and inoculate cells but without the drug (negative control). Approximately 48 h after gemcitabine treatment, MTT (Sigma, USA) was added to a final concentration of 5.0 mg/ml, and the cells were incubated for 4 h at 37°C. And then, sucked out the supernatant and added 150 μL DMSO/well, oscillated it 5 minutes. Absorbance of each well at 490 nm (A490) was read using a spectrophotometer. The formula for calculating cell viability is (absorbance of experimental group-absorbance of control group)/(absorbance of negative control group-absorbance of control group) × 100%. The concentration at which each drug produced 50% inhibition of growth (IC50) was estimated from relative survival curves. Three independent experiments were performed in six duplicate wells.
RNA extraction and RNA quality control
Total RNA was extracted from the cells mentioned above using the Trizol reagents (Invitrogen), rRNAwas removed from total RNA and purified RNA was amplified and transcribed to produce fluorescent cRNA, according to the manufacturer’s protocol, the whole process were on ice. RNA quantity and quality were measured by NanoDrop ND-1000 and RNA integrity was assessed by standard denaturing agarose gel electrophoresis. Isolated RNAs were stored at -70°C prior to lncRNAs arrays analysis and Quantitative real-time PCR.
RNA labeling and array hybridization
Sample labeling and array hybridization were performed according to the Agilent One-Color Microarray-Based Gene Expression Analysis protocol (Agilent Technology) with minor modifications. Briefly, mRNA was purified from 1 μg total RNA after removal of rRNA (mRNA-ONLY™ Eukaryotic mRNA Isolation Kit, Epicentre). Then, each sample was amplified and transcribed into fluorescent cRNA along the entire length of the transcripts without 3’ bias utilizing a random priming method. The labeled cRNAs were purified by RNAeasy Mini Kit (Qiagen). The concentration and specific activity of the labeled cRNAs (pmol Cy3/μg cRNA) were measured by NanoDrop ND-1000. 1 μg of each labeled cRNA was fragmented by adding 11 μl 10 × Blocking Agent and 2.2 μl of 25 × Fragmentation Buffer, then heated the mixture at 60°C for 30 min, finally 55 μl 2 × GE Hybridization buffer was added to dilute the labeled cRNA. 100 μl of hybridization solution was dispensed into the gasket slide and assembled to the LncRNA expression microarray slide. The slides were incubated for 17 hours at 65°C in an Agilent Hybridization Oven. The hybridized arrays were washed, fixed and scanned with using the Agilent DNA Microarray Scanner (part number G2505B).
Data analysis
Agilent Feature Extraction software (version 10.7.3.1) was used to analyze acquired array images. Quantile normalization and subsequent data processing were performed with using the GeneSpring GX v11.5.1 software package (Agilent Technologies). After quantile normalization of the raw data, LncRNAs and mRNAs that at least 1 out of 2 samples have flags in Present or Marginal (“All Targets Value”) were chosen for further data analysis. Differentially expressed LncRNAs and mRNAs were identified through Fold Change filtering. Hierarchical Clustering was performed using the Agilent GeneSpring GX software (version 11.5.1). GO analysis and Pathway analysis were performed in the standard enrichment computation method.
Quantitative real-time PCR analysis of lncRNA and mRNA
The expression of lncRNA and mRNA was detected by qRT-PCR. Total RNA was extracted from the cells mentioned above using the Trizol reagents (Invitrogen, CA). Briefy, cDNAs were synthesized from total RNA using the First Stand cDNA Synthesis kit (Fermentas Life Science, Burling, ON, Canada). Primers for six lncRNAs and nine mRNAs were designed and synthesized (Table 1). β-actin was used as an internal control. Reactions were incubated for 5 mins at 37°C, 60 mins at 42°C, 10 mins at 70°C, and then stored at -20°C. Quantitative PCR was then performed by using SYBR Green PCR Master Mix (ABI) in Stepone plus realtime PCR detection system (ABI). The reactions were incubated at 95°C for 3 min, followed by 40 cycles at 95°C for 15 s and at 60°C for 40 s. All reactions were run in triplicate. Relative quantitation of lncRNAs and mRNAs expression levels was analyzed by the 2(-ΔΔCt) methods.
Table 1.
Primers sequences for lncRNAs and mRNAs
| Gene name | Forward (5’-3’) | Reverse (5’-3’) |
|---|---|---|
| RP11-58D2.1 | CAGGAGAATCGCTTGAACCC | ATGGAGTCTTGCTCTGTTGCC |
| lincRNA-ZNF532 | CAGTTGAAGGCGAAAAGGG | AGATGGTTGAAAAGACCGTGAG |
| AP000221.1 | CTTTTAGATGTGGGATGTGGTAGG | GCAGGGATTAGGGCATAGACA |
| CTC-338M12.5 | CTCTTAGGGAGATGGAAACTGGA | AGACTGGGTCTTGCTATGTTGC |
| CR619813 | TGCGAGTCTTGCCCTTACCT | CTGACCCCATGAACCATCCT |
| DDX6P | GTGTTTGCTGACCTGGATGC | CCATTGCTTTATCTGGTAGGGA |
| SYT1 | CAATAGCCATAGTCGCAGTCCT | TGTCAATCCAGTTTCAGCATCA |
| FAM171B | CTAAAAGAAGGGGCAGACCAC | AACAGCACGAGACAGCAGACA |
| ZNF331 | TGTAACCACCTAAACCATCTCCG | ATAGATACGAGCGGGCTACTGC |
| FAM187B | GGGGTTCTACTTTTCCATCAGC | CCCTCGGGCATTATTTCCA |
| CYP1A1 | GATGAGAACGCCAATGTCCA | TGGGGTTCATCACCAAATACA |
| SRXN1 | ACTCCACGAAGGTAGGGGTCA | CCTCCTTCCTTGAACGCAGA |
| HIST1H2BL | CAGAAGAAGGATGGCAAGAAGC | GAAGATGTCGTTGACGAAGGAGT |
| TOMM40L | TGGGAAAGTAGGGCTGAAGG | GAAGCACAGAAGATGGGAAGG |
| SPP1 | TAAATTCTGGGAGGGCTTGG | GTAGTGAGTTTTCCTTGGTCGG |
| β-actin | TAGTTGCGTTACACCCTTTCTTG | TCACCTTCACCGTTCCAGTTT |
Statistical analysis
The GraphPad Prism 5.0 (GraphPad Software, LaJolla, CA) was used for statistical analysis. Data are expressed as the means ± SD. For a single comparison of 2 groups, Student’s t test was used. Differences were considered statistically significant at P < 0.05. *P < 0.05, **P < 0.01 and ***P < 0.001.
Results
The drug-resistance index of SW1990/GZ
The gemcitabine-resistance of SW1990/GZ cell line was identified by evaluating the IC50-value of SW1990 against parental SWl990 cell line. As showed in Figure 1, the IC50 of gemcitabine for the drug-resistant SW1990/GZ cell line was 230.46 ± 5.31 µmol/L which was 76.1 times higher than that of parental cell line SWl990 (3.03 ± 0.27 µmol/L). Therefore, the drug-resistance index of SWl990/GZ cells relative to the parental SW1990 cells was 76.1 (**P < 0.01). This result demonstrated that the cells SW1990/GZ were more resistant to gemcitabine than the parental cells.
Figure 1.
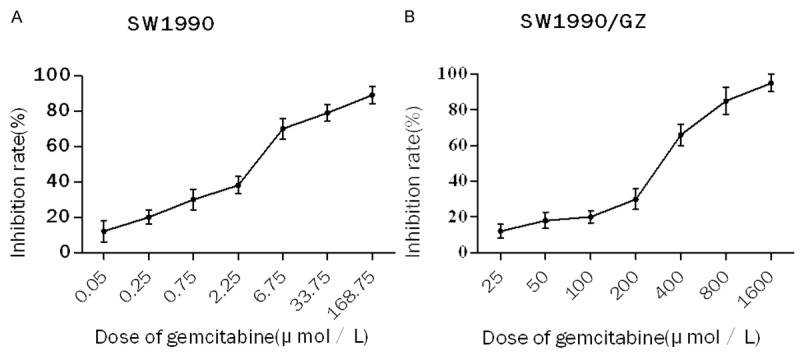
Inhibition rate of SW1990 and SW1990/GZ cells. A. SW1990 cells were treated in various doses of gemcitabine (0.05, 0.25, 0.75, 2.25, 6.75, 33.75 and 168.75 μmol/L) for 48 h. B. SW1990/GZ cells were treated in various doses of gemcitabine (GZ) (25, 50, 100, 200, 400, 800, 1600 μmol/L) for 48 h. Cells viability was determined using MTT assay.
RNA quality control (QC)
RNA Quantification and Quality were assured by the NanoDrop ND-1000, for spectrophotometer, the O.D. A260 /A280 ratios of the total RNA between 1.8 and 2.1. The O.D. A260/A230 ratios of the total RNA should be more than 1.8. The integrity of RNA can be assessed by electrophoresis on a denaturing agarose gel. The 28 S and 18 S ribosomal RNA bands should be fairly sharp, intense bands. The 28 s rRNA band should be about twice as intense as the 18 s rRNA band. Therefore, the RNA samples are qualified, they can be used in the next experiment.
Microarray hybridization data
Arraystar Human LncRNA Microarray v2.0 is designed for the global profiling of human lncRNAs and protein-coding transcripts. 33,045 lncRNAs and 30,215 coding transcripts can be detected by the second-generation lncRNA microarray. After the quantile normalization and data filtering steps, 13310 (40.3%) lncRNAs and 13886 (45.0%) mRNAs were identified from the SW1990 cells and the SW1990/GZ cells for fold-change comparison. The heat map of the hierarchical clustering results was performed to show the distinguishable lncRNAs and mRNAs expression profiling between the two groups (Figure 2A and 2B). The scatterplot results showed that the distribution and expression variation of the log 2 ratios of lncRNAs and mRNAs between the two groups were nearly the same (Figure 2C and 2D).
Figure 2.
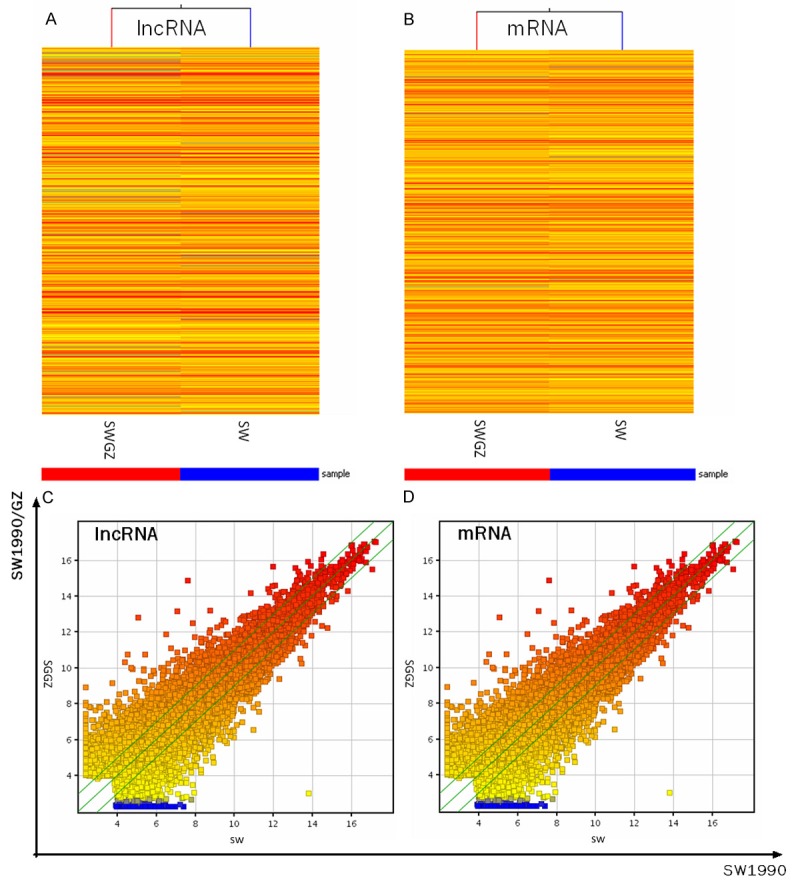
lncRNAs and mRNAs expression profile comparison between the SW1990 cells and the SW1990/GZ cells. (A) The hierarchical clustering of all targets value lncRNAs and (B) mRNAs showed a distinguishable lncRNA and mRNA expression profiling among samples. (C) The scatter-plot was used for assessing the lncRNA and (D) mRNA expression variation between the SW1990 cells and the SW1990/GZ cells. The values of x-axis and y-axis in the scatter-plot were the normalized signal values of each sample (log 2 scaled). The green lines are fold change lines (the default fold change value given is 2.0). The lncRNAs above the top green line and below the bottom green line indicated > 2.0-fold change in expression of lncRNAs between the 2 compared samples ‘Red’ denotes high relative expression levels, and ‘blue’ denotes low relative expression levels.
Aberrantly expressed mRNA and lncRNA profiles
We screened the gene expression patterns in the SW1990 cells and the SW1990/GZ cells with the human microarray method. We found that 4983 of 13310 detected lncRNAs demonstrated > 2-fold differential expression with 1993 lncRNAs showing up-regulated and 2990 lncRNAs showing down-regulated. At the same time, 4759 mRNAs displayed beyond a 2-fold differential expression in SW1990/GZ cells when compared to SW1990 cells, 2671 mRNAs were up-regulated while 2088 mRNAs were down-regulated. Significantly and dominant differentially expressed (fold change (log 2) > 5.0 or < -5.0) lncRNAs and mRNAs (the top deregulated species could be found in Tables 2 and 3) were listed.
Table 2.
Differentially expressed long non-coding RNAs in SW1990/GZ [fold change (log 2) > 5]
| Sequence Name | Gene Symbol | Chr (+/-) | Fold change | UP/down |
|---|---|---|---|---|
| ENST00000472323 | RP11-58D2.1 | chr3 (+) | 6.08 | Up |
| AK128058 | lincRNA-ZNF532 | chr18 (+) | 6.02 | Up |
| BC036409 | / | chr7 (-) | 5.86 | Up |
| ENST00000419190 | RP11-465N4.4 | chr1 (-) | 5.75 | Up |
| ENST00000419694 | AP000221.1 | chr21 (-) | 5.74 | Up |
| ENST00000449714 | AC144449.1 | chr2 (+) | 5.28 | Up |
| uc002iyl.2 | AF086204 | chr17 (-) | 5.23 | Up |
| ENST00000414485 | RP11-169O17.1 | chr13 (+) | 5.21 | Up |
| ENST00000443851 | RP13-824C8.2 | chrX (-) | 5.20 | Up |
| ENST00000514487 | CTC-338M12.5 | chr5 (+) | -7.04 | Down |
| uc010meg.2 | CR619813 | chr8 (+) | -5.93 | Down |
| ENST00000441966 | DDX6P | chr6 (-) | -5.51 | Down |
| uc.255+ | uc.255 | chr9 (+) | -5.39 | Down |
| ENST00000457739 | RP11-264P13.2 | chrX (-) | -5.39 | Down |
| ENST00000430203 | CFLP3 | chr1 (-) | -5.38 | Down |
| ENST00000512634 | RP11-87F15.2 | chr4 (-) | -5.31 | Down |
| ENST00000514084 | OR5H7P | chr3 (+) | -5.27 | Down |
| BC063868 | / | chr5 (+) | -5.25 | Down |
| ENST00000511385 | RP11-138B4.1 | chr4 (-) | -5.16 | Down |
| ENST00000505494 | RP11-61G19.1 | chr4 (+) | -5.11 | Down |
| ENST00000514420 | RP11-453E17.3 | chr4 (-) | -5.03 | Down |
Table 3.
Differentially expressed protein-coding RNAs inSW1990/GZ [fold change (log 2) > 5]
| GeneSymbol | Fold change | UP/down | Description |
|---|---|---|---|
| SYT1 | 7.19 | UP | Synaptotagmin I |
| FAM171B | 5.80 | UP | Family with sequence similarity 171, member B |
| ZNF331 | 5.78 | UP | Zinc finger protein 331 |
| FAM187B | 5.63 | Up | Family with sequence similarity 187, member B |
| CYP1A1 | 5.43 | Up | Cytochrome P450, family 1, subfamily A, polypeptide 1 |
| OAS2 | 5.37 | Up | 2’-5’-oligoadenylate synthetase 2, 69/71 kDa |
| PRR15L | 5.36 | Up | Proline rich 15-like |
| C10orf105 | 5.35 | Up | Chromosome 10 open reading frame 105 |
| IFI6 | 5.23 | Up | Interferon, alpha-inducible protein 6 |
| HIST1H4E | 5.22 | UP | Histone cluster 1, H4e |
| NOL4 | 5.13 | UP | Nucleolar protein 4 |
| C3AR1 | 5.12 | Up | Complement component 3a receptor 1 |
| C9orf150 | 5.11 | Up | Chromosome 9 open reading frame 150 |
| CXCR2 | 5.08 | Up | Chemokine (C-X-C motif) receptor 2 |
| RAB2B | 5.04 | Up | RAB2B, member RAS oncogene family |
| SRXN1 | -6.84 | Down | Sulfiredoxin 1 |
| HIST1H2BL | -5.38 | Down | Histone cluster 1, H2bl |
| TOMM40L | -5.21 | Down | Translocase of outer mitochondrial membrane 40 homolog (yeast)-like |
| SPP1 | -5.19 | Down | Secreted phosphoprotein 1 |
| KRT6B | -5.05 | Down | Keratin 6B |
It has been reported in the article that chromosomal imbalances associated with drug resistance and thermoresistance are mainly distributed in chromosomes 1, 2, 4, 6, 7, 9, 10, 13, 14 and 15 in human pancreatic carcinoma cells [19]. In this study, aberrantly expressed lncRNAs and mRNAs were found to be prone to be located on chromosomes 1, 2, 3, 5, 6, 7, 9, 10, 11 and 17, especially on chromosome 1 (Figure 3A-C). Downregulation was found to be more common than upregulation in lncRNA expression profile, and the mRNA expression profile is converse (Figure 3A, 3B). Different locational distribution patterns were discovered in the light of the total number of upregulated and down regulated lncRNA and mRNA species (Figure 3C). Noncoding and coding RNAs pointed different ratios of upregulated species and downregulated species (Figure 3D).
Figure 3.
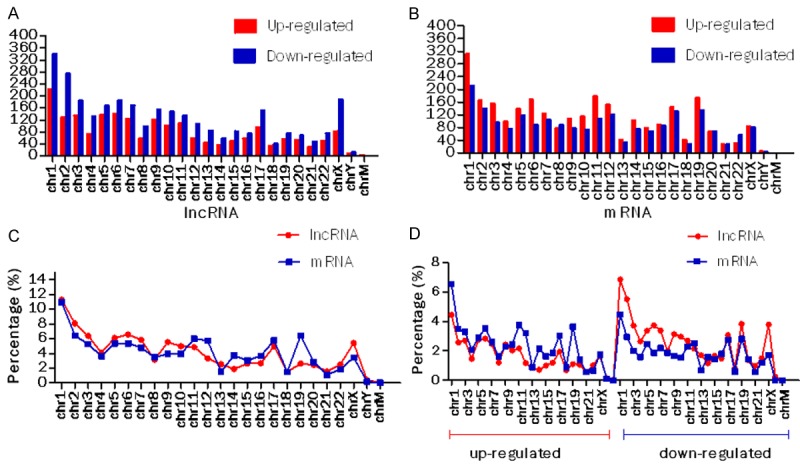
Distribution of significantly expressed lncRNA and mRNA expression profiles. Location distributions of aberrantly expressed (A) lncRNA and (B) mRNA profiles on human chromosomes. The number of deregulated species, including detailed upregulated and downregulated lncRNAs and mRNAs. “chr”: chromosome; “chrM”: mitochondrial chromosome. (C) Distribution of total deregulated lncRNAs and mRNAs. (D) Distribution of upregulated and downregulated species.
Pathway analysis and go analysis of the differentially expressed mRNAs
Pathway analysis was used to identify significant pathways for the differential genes according to the Kyoto Encyclopedia of Genes and Genomes, Biocarta and Reatome databases [20]. We identified a total of 40 pathways that showed significant differences due to differential gene expression. The upregulated genes were involved in 19 pathways while downregulated genes were involved in 21 pathways. The predominant pathways were shown in Figure 4A and 4B. The top 3 upregulated pathways were Lysosome, Toll-like receptor signaling pathway, and Epithelial cell signaling in Helicobacter pylori infection. The top 3 downregulated pathways were Homologous recombination, DNA replication and beta-Alanine metabolism. They also contributed to occurrence and development of some human diseases, such as pancreatic cancer, small cell lung cancer, bladder cancer, chronic myeloid leukemia and non-small cell lung cancer.
Figure 4.
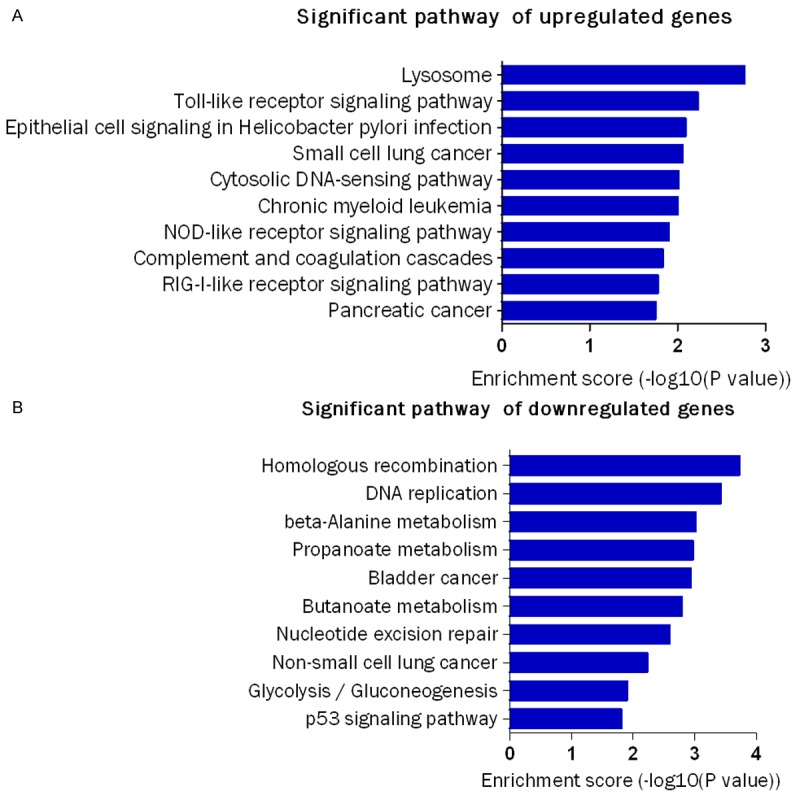
Analysis of significant pathways .The figure shows the top 10 significant pathways of downregulated and upregulated genes. The P-value (Fisher-P value) denotes the significance of the Pathway correlated to the conditions. Lower the P-value, more significant is the Pathway (The recommend P-value cut-off is 0.05).
GO analysis was applied to analyze the main function of the closest coding genes according to the GO database which provides the key functional classifications for the National Center for Biotechnology Information (NCBI) [21]. The GO categories were comprised of 3 structured networks: biological processes, cellular components and molecular function [22]. In our survey of existing data, the differentially expressed genes were mainly enriched for GO terms related to regulation of transcription, protein localization, cell cycle and phosphate metabolic process involved in biological processes, and cation binding, metal ion binding, purine nucleoside binding and ribonucleotide binding linked with molecular functions, as well as membrane-enclosed lumen, organelle lumen, non-membrane-bounded organelle and intracellular organelle lumen binding in cellular components. The significance of GO term (Top ten) were shown (Figure 5).
Figure 5.
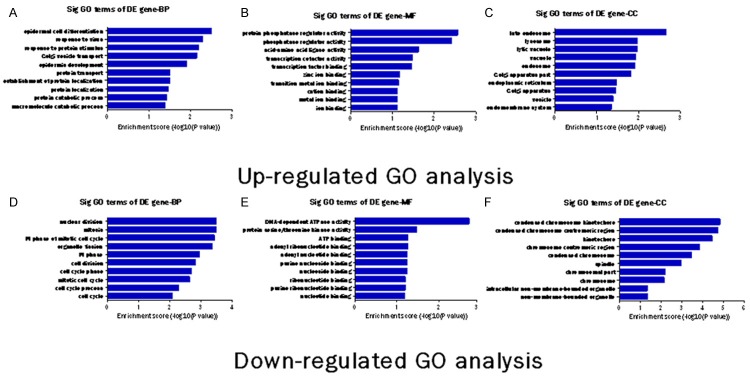
Gene Ontology (GO) analysis of functional classification of the differentially expressed genes. The GO categories cover three domains: Biological Process, Molecular Function and Cellular Component. The (A-C) are up-regulated GO analysis. The (C-E) are down-regulated GO analysis. The p-value denotes the significance of GO terms enrichment in the differentially expressed mRNA list. The lower the p-value is, the more significant the GO Term is (p-value ≤ 0.05 is recommended).
Validation of the microarray data using qPCR
Six lncRNAs (RP11-58D2.1, lincRNA-ZNF532, AP000221.1, CTC-338M12.5, CR619813, DDX6P) were selected to validate the microarray consistency by using qPCR. The results demonstrated that RP11-58D2.1, lincRNA-ZNF532 and AP000221.1 were upregulated and that CTC-338M12.5, DDX6P and CR619813 were downregulated in the SW1990/GZ cells compared with SW1990 cells (Figure 6). For mRNA, SYT1, FAM171B, ZNF331, FAM187B and CYP1A1 were upregulated and that SRXN1, HIST1H2BL, TOMM40L and SPP1 were downregulated in the SW1990/GZ cells compared with SW1990 cells (Figure 7). The qRT-PCR results are consistent with microarray data.
Figure 6.
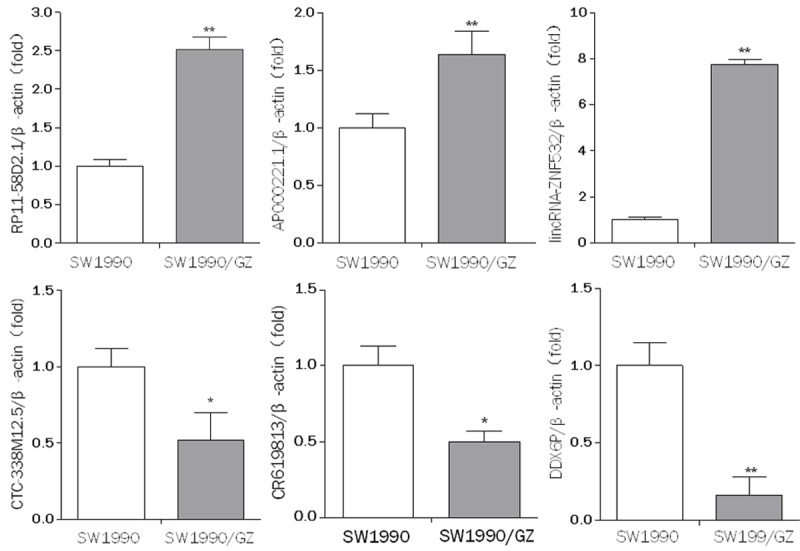
qRT-PCR results show diferential lncRNA expression levels in SW1990 cells and SW1990/GZ cells. The expression levels of RP11-58D2.1, lincRNA-ZNF532, AP000221.1, CTC-338M12.5, CR619813, DDX6P in SW1990 cells and SW1990/GZ cells were measured by qRT-PCR. Expression levels were normalized for β-actin. Data are expressed as the means ± SD (n = 6). Differences were considered statistically significant at P < 0.05 (*P < 0.05, **P < 0.01).
Figure 7.
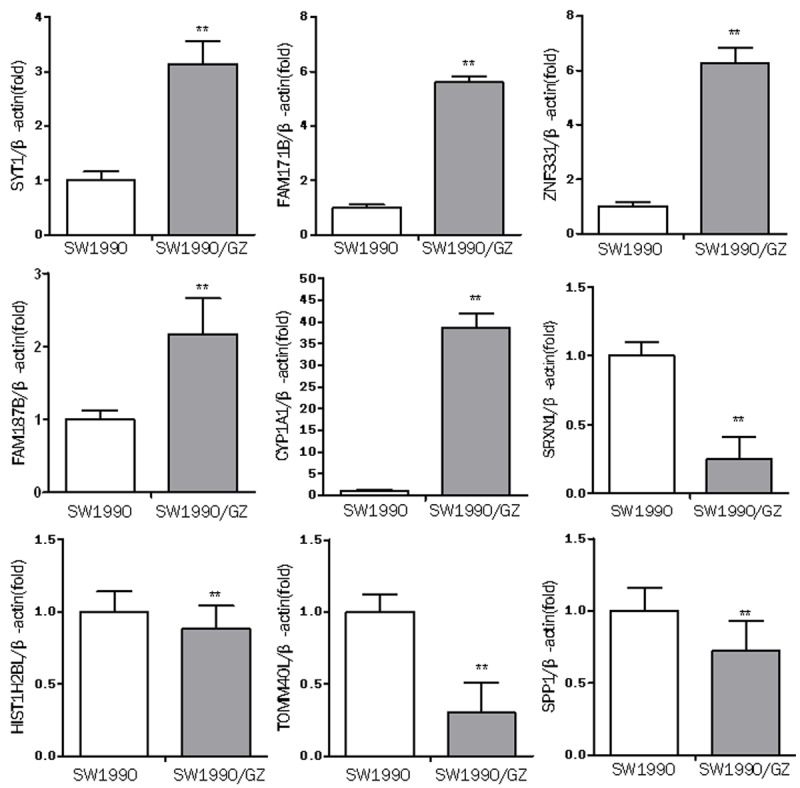
qRT-PCR results show diferential mRNA expression levels in SW1990 cells and SW1990/GZ cells. The expression levels of SYT1, FAM171B, ZNF331, FAM187B, CYP1A1, SRXN1, HIST1H2BL, TOMM40L, SPP1 in SW1990 cells and SW1990/GZ cells were measured by qRT-PCR. Expression levels were normalized for β-actin. Data are expressed as the means ± SD (n = 6). Differences were considered statistically significant at P < 0.05 (*P < 0.05, **P < 0.01).
The regulation of gemcitabine on the expression of lincRNA-ZNF53 and DDX6P
In order to investigate how gemcitabine regulate the expression of lincRNA-ZNF53 and DDX6P, we determined the level of lincRNA-ZNF53 and DDX6P in SW1990 cells when treated by gemcitabine at different concentration and different time using quantitative real time PCR. We found that the relative level of lincRNA-ZNF53 was gradually increasing with the exposure time to gemcitabine in SW1990 cells (Figure 8A). Meanwhile, all of treatment by gemcitabine at a range from 1.0 µM to 16.0 µM induced a increase of lincRNA-ZNF53 in SW1990 cells (Figure 8B). However, the relative level of DDX6P is opposite to that of lincRNA-ZNF53 in the same circumstances (Figure 8C and 8D).
Figure 8.
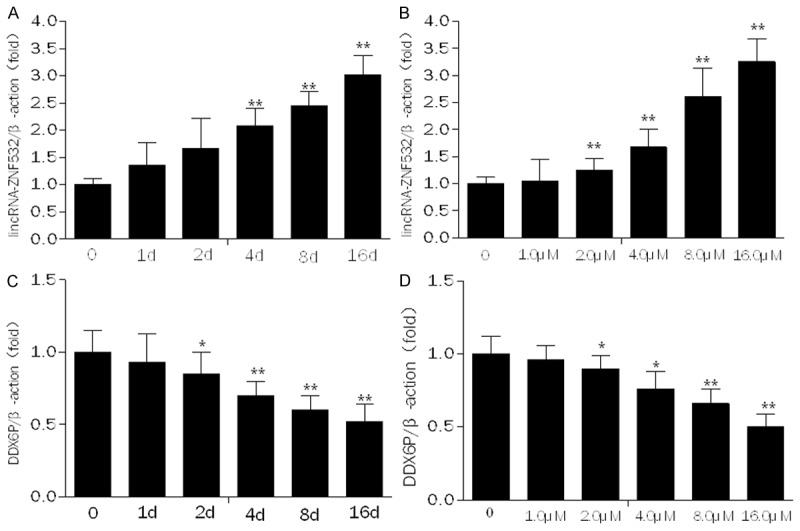
The regulation of gemcitabine on the expression of lincRNA-ZNF532 and DDX6P in SW1990 cells. The expression of lincRNA-ZNF532 and DDX6P in SW1990 cells treated by gemcitabine (1.5 μM) at different time and at different concentration for 24 h was measured by qRT-PCR. Expression levels were normalized forβ-actin. Data are expressed as the means ± SD (n = 6). Differences were considered statistically significant at P < 0.05 (*P < 0.05, **P < 0.01).
Discussion
Drug resistance includes intrinsic and acquired. Intrinsic resistance occurs without prior exposure, while acquired resistance develops during treatment in the absence of initial sensitivity [23]. Although gemcitabine is a widely used drug for treating advanced pancreatic cancers, acquired gemcitabine resistance in a substantial number of patients appears to hinder its effectiveness in successful treatment of this dreadful disease [24]. The resistance of tumor cells to cytotoxic drugs is the major cause of failure of chemotherapy [25]. Thus, drug resistance of tumor cells has been the theme of intense study and has made surprising progress in the past few decades. Previous studies have indicated a variety of mechanisms of drug resistance in pancreatic cancer, including tumor microenvironment, aberrant gene expression, mutations, miRNAs (such as miR-21, miR-10b and miR-34b), deregulation of key signaling pathways (such as Akt, NF-κB and apoptosis pathways), DNA hypermethylation (such as TMS1 and DKK3), epithelial-mesenchymal transition (EMT), heat-shock protein 27 (HSP-27) and the presence of stroma cells, highly resistant cells and cancer stem cells(CSCs) [26-30].
What’s more, evidence is beginning to demonstrate that lncRNAs also plays a significant role in chemotherapy sensitivity. Yang et al. [31] found that lncRNAs are differently expressed between Lung adenocarcinoma cells A549 and A549/CDDP cells, many of which could regulate cisplatin resistance via different ways. And lnRNA-AK126698 was found to confer cisplatin resistance by targeting the Wnt signaling pathway. Cui J et al [32] concluded that the dysregulation of Wnt/β-catenin signaling pathway is also involved in pancreatic cancer chemoresistance. Min Jiang et al [33] showed that a novel lncRNA-ARA, ARA expression is significantly associated with adriamycin sensitivity in a panel of liver and breast cancer cell lines and is markedly up-regulated in parental sensitive HepG2 and MCF-7 cell lines after receiving adriamycin treatment. Liu et al [6] showed that HOTAIR (a long intervening non-coding RNA, lincRNA) expression was significantly upregulated in cisplatin-resistant A549/DDP cells compared with in parental A549 cells. Additionally, they demonstrated that upregulation of HOTAIR contributes to the cisplatin resistance of Lung adenocarcinoma cells, through the regulation of p21 expression. Kim et al [34] used RNA interference showed that HOTAIR was associated with enhanced cell proliferation, cell invasion, modulation of cell cycle progression, and induction of apoptosis in Panc1 and L3.6pL pancreatic cancer cells. Similarly, Fan Y et al [35] found that cisplatin-based chemotherapy results in up-regulation of lncRNA-UCA1 (urothelial cancer-associated 1) expression in patients with bladder cancer, finally they demonstrate that UCA1 increases the cisplatin resistance of bladder cancer cells by enhancing the expression of Wnt6. However, the correlations between lncRNAs and pancreatic cancer chemoresistance are rarely reported, and need to be more clearly elucidated before these therapeutic strategies can be fully developed and undergo clinical assessment [6]. In order to discover the new molecular mechanisms of resistance to gemcitabine, we generated a gemcitabine-resistant pancreatic cancer cell line using stepwise selection, as a cellular model to study drug-resistance in pancreatic cancer, and we used high-throughput microarrays technologies found that lncRNA expression profiles are different between the SW1990 cells and the SW1990/GZ cells. Further studies revealed that the upregulating of gemcitabine on the expression of lincRNA-ZNF532 was time-dependent. Gemcitabine at a range from 1.0 µM to 16.0 µM induced a increase of lincRNA-ZNF532 in SW1990 cells. The relative level of DDX6P is opposite to that of lincRNA-ZNF53 in the same circumstance. This two lncRNAs have not been previously reported in the literature, so their regulation mechanism and function is not clear. Further studies, including over expression and knockdown of lncRNA and western blotting analyses, their expression changes in clinical pancreatic cancer tissues, is required.
Simultaneously, a total of 4759 mRNAs was identified as differentially expressed transcripts between SW1990 cells and SW1990/GZ cells. Expression of SYT1, FAM171B, ZNF331, FAM187B, CYP1A1, SRXN1, HIST1H2BL, TOMM40L and SPP1 was the most greatly altered in gemcitabine-resistant pancreatic cancer cell line, which was also confirmed with qRT-PCR. The former five genes were up-regulated, while the latter four genes were down-regulated. Within the nine genes, CYP1A1 is intriguing. qRT-PCR showed the level of CYP1A1 in SW1990/GZ cells was up-regulated nearly to 40 fold compared to its parental pancreatic cancer cell line SW1990. CYP1A1 in human measures 2608 nucleotides in length, one of P450 family members, encoding aromatic hydrocarbon hydroxylase and is involved in the metabolic activation of benzopyrene-catalyzed 7, 8-dihydroxy-9, 10-epoxy P(a)B [36]. Xu [37] et al demonstrate that CYP1A1 is involved in Dll1-induced bortezomib resistance in multiple myeloma cells. Li [36] et al discovered that CYP1A1 genes are associated with chemotherapy response in non-small-cell lung cancer patients. Thus, it indicates that CYP1A1 might be potential markers for gemcitabine sensitivity in pancreatic cancer.
To identify the important factors that regulated drug-resistance,we used bioinformatics analyses to classify the microarray data. The KEGG pathway of the commonly dysregulated genes provided us with substantial information about drug-resistance. KEGG annotation showed that 19 pathways corresponded to upregulated transcripts and 21 pathways corresponded to downregulated transcripts in our study. It showed that many important pathways such as cell cycle, MAPK signaling pathway, p53 signaling pathway, Gap junction, Glycolysis/Gluconeogenesis, cytokine-cytokine receptor interaction ,Toll-like receptor signaling pathway, Jak-STAT signaling pathway and RIG-I-like receptor signaling pathway. Some of these pathways have previously been reported correlated with gemcitabine sensitivity in other cell lines. Bu [38] et al discovered that oridonin can potentiate the effects of gemcitabine in PaCa cell through the mitogen-activated protein kinase (MAPK)-p38 signaling pathway, which is dependent on p53 activation. Chang [39] et al had reported extracellular signal-regulated kinase (ERK) activation and Akt inactivation mediated gemcitabine-induced apoptosis independently of p53 pathway in human NSCLC H1299 cells. And many other pathways such as nucleotide excision repair, apoptosis, DNA replication had also been proved to play important roles in the mechanism of gemcitabine resistance in diverse cancer cell lines [40-42].
Based on the previous drug-resistance studies, our work may provide novel angle to explain the molecular mechanism of pancreatic cancer chemotherapy resistance. However, our results were only based on an in vitro cell line model, it needs more proofs set for further confirmation, which indicates clinical sample and in vivo validation is warranted in the future.
Conclusion
Taken together, drug-resistance of pancreatic cancer is a multi factorial and complicated process. In the present study, numerous dysregulated lncRNAs and mRNAs were obtained by comparing the lncRNA and mRNA expression profiles of the drug resistant cell line with its parental cell line, many of which may play a key role in regulating gemcitabine resistance through various mechanisms, we will spare no effort to explore it in future research. The dysregulated lncRNAs and mRNAs identified in this work may represent good candidates for future diagnostic or prognostic biomarkers and therapeutic targets. LncRNA which is potentially a novel type of predictive biomarker can identify subgroups of patients who can benefit from chemotherapy. Furthermore, lncRNA will provide treatment guidance with great significance.
Disclosure of conflict of interest
None.
References
- 1.Sarkar FH, Banerjee S, Li Y. Pancreatic cancer: pathogenesis,prevention and treatment. Toxicol Appl Pharmacol. 2007;224:326–336. doi: 10.1016/j.taap.2006.11.007. [DOI] [PMC free article] [PubMed] [Google Scholar]
- 2.Kaur S, Kumar S, Momi N, Sasson AR, Batra SK. Mucins in pancreatic cancer and its microenvironment. Nat Rev Gastroenterol Hepatol. 2013;10:607–620. doi: 10.1038/nrgastro.2013.120. [DOI] [PMC free article] [PubMed] [Google Scholar]
- 3.Bournet B, Gayral M, Torrisani J, Selves J, Cordelier P, Buscail L. Role of endoscopic ultrasound in the molecular diagnosis of pancreatic cancer. World J Gastroenterol. 2014;20:10758–10768. doi: 10.3748/wjg.v20.i31.10758. [DOI] [PMC free article] [PubMed] [Google Scholar]
- 4.Khan MF, Gottesman S, Boyella R, Juneman E. Gemcitabine-induced cardiomyopathy: a case report and review of the literature. J Med Case Rep. 2014;8:220. doi: 10.1186/1752-1947-8-220. [DOI] [PMC free article] [PubMed] [Google Scholar]
- 5.Mittal A, Chitkara D, Behrman SW, Mahato RI. Efficacy of gemcitabine conjugated and miRNA-205 complexed micelles for treatment of advanced pancreatic cancer. Biomaterials. 2014;35:7077–87. doi: 10.1016/j.biomaterials.2014.04.053. [DOI] [PubMed] [Google Scholar]
- 6.Liu Z, Sun M, Lu K, Liu J, Zhang M, Wu W, De W, Wang Z, Wang R. The Long Noncoding RNA HOTAIR Contributes to Cisplatin Resistance of Human Lung Adenocarcinoma Cells via downregualtion of p21WAF1/CIP1 Expression. PLoS One. 2013;8:e77293. doi: 10.1371/journal.pone.0077293. [DOI] [PMC free article] [PubMed] [Google Scholar]
- 7.Okazaki Y, Furuno M, Kasukawa T, Adachi J, Bono H, Kondo S, Nikaido I, Osato N, Saito R, Suzuki H, Yamanaka I, Kiyosawa H, Yagi K, Tomaru Y, Hasegawa Y, Nogami A, Schönbach C, Gojobori T, Baldarelli R, Hill DP, Bult C, Hume DA, Quackenbush J, Schriml LM, Kanapin A, Matsuda H, Batalov S, Beisel KW, Blake JA, Bradt D, Brusic V, Chothia C, Corbani LE, Cousins S, Dalla E, Dragani TA, Fletcher CF, Forrest A, Frazer KS, Gaasterland T, Gariboldi M, Gissi C, Godzik A, Gough J, Grimmond S, Gustincich S, Hirokawa N, Jackson IJ, Jarvis ED, Kanai A, Kawaji H, Kawasawa Y, Kedzierski RM, King BL, Konagaya A, Kurochkin IV, Lee Y, Lenhard B, Lyons PA, Maglott DR, Maltais L, Marchionni L, McKenzie L, Miki H, Nagashima T, Numata K, Okido T, Pavan WJ, Pertea G, Pesole G, Petrovsky N, Pillai R, Pontius JU, Qi D, Ramachandran S, Ravasi T, Reed JC, Reed DJ, Reid J, Ring BZ, Ringwald M, Sandelin A, Schneider C, Semple CA, Setou M, Shimada K, Sultana R, Takenaka Y, Taylor MS, Teasdale RD, Tomita M, Verardo R, Wagner L, Wahlestedt C, Wang Y, Watanabe Y, Wells C, Wilming LG, Wynshaw-Boris A, Yanagisawa M, Yang I, Yang L, Yuan Z, Zavolan M, Zhu Y, Zimmer A, Carninci P, Hayatsu N, Hirozane-Kishikawa T, Konno H, Nakamura M, Sakazume N, Sato K, Shiraki T, Waki K, Kawai J, Aizawa K, Arakawa T, Fukuda S, Hara A, Hashizume W, Imotani K, Ishii Y, Itoh M, Kagawa I, Miyazaki A, Sakai K, Sasaki D, Shibata K, Shinagawa A, Yasunishi A, Yoshino M, Waterston R, Lander ES, Rogers J, Birney E, Hayashizaki Y FANTOM Consortium; RIKEN Genome Exploration Research Group Phase I & II Team. Analysis of the mouse transcriptome based on functional annotation of 60,770 full-length cDNAs. Nature. 2002;420:563–73. doi: 10.1038/nature01266. [DOI] [PubMed] [Google Scholar]
- 8.Qi P, Xu MD, Ni SJ, Huang D, Wei P, Tan C, Zhou XY, Du X. Low expression of LOC285194 is associated with poor prognosis in colorectal cancer. J Transl Med. 2013;11:122. doi: 10.1186/1479-5876-11-122. [DOI] [PMC free article] [PubMed] [Google Scholar]
- 9.Ponting CP, Belgard TG. Transcribed dark matter: meaning or myth? Hum Mol Genet. 2010;19:R162–R168. doi: 10.1093/hmg/ddq362. [DOI] [PMC free article] [PubMed] [Google Scholar]
- 10.Zhang H, Chen ZH, Wang XX, Huang ZN, He ZW, Chen YQ. Long non-coding RNA: a new player in cancer. J Hematol Oncol. 2013;6:37. doi: 10.1186/1756-8722-6-37. [DOI] [PMC free article] [PubMed] [Google Scholar]
- 11.Gibb EA, Brown CJ, Lam WL. The functional role of long non-coding RNA in human carcinomas. Molecular Cancer. 2011;10:38. doi: 10.1186/1476-4598-10-38. [DOI] [PMC free article] [PubMed] [Google Scholar]
- 12.Tang SC, Chen YC. Novel therapeutic targets for pancreatic cancer. World J Gastroenterol. 2014;20:10825–10844. doi: 10.3748/wjg.v20.i31.10825. [DOI] [PMC free article] [PubMed] [Google Scholar]
- 13.Kim K, Jutooru I, Chadalapaka G, Johnson G, Frank J, Burghardt R, Kim S, Safe S. HOTAIR is a negative prognostic factor and exhibits pro-oncogenic activity in pancreatic cancer. Oncogene. 2013;32:1616–1625. doi: 10.1038/onc.2012.193. [DOI] [PMC free article] [PubMed] [Google Scholar]
- 14.Liu JH, Chen G, Dang YW, Li CJ, Luo DZ. Expression and prognostic significance of lncRNA MALAT1 in pancreatic cancer tissues. Asian Pac J Cancer Prev. 2014;15:2971–7. doi: 10.7314/apjcp.2014.15.7.2971. [DOI] [PubMed] [Google Scholar]
- 15.Ma C, Nong K, Zhu H, Wang W, Huang X, Yuan Z, Ai K. H19 promotes pancreatic cancer metastasis by derepressing let-7’s suppression on its target HMGA2-mediated EMT. Tumour Biol. 2014;35:9163–9. doi: 10.1007/s13277-014-2185-5. [DOI] [PubMed] [Google Scholar]
- 16.Lu X, Fang Y, Wang Z, Xie J, Zhan Q, Deng X, Chen H, Jin J, Peng C, Li H, Shen B. Downregulation of gas5 increases pancreatic cancer cell proliferation by regulating CDK6. Cell Tissue Res. 2013;354:891–6. doi: 10.1007/s00441-013-1711-x. [DOI] [PubMed] [Google Scholar]
- 17.Yang XF, LGao , Guo XL, Shi XH, Wu H, Song F LGao. A Network Based Method for Analysis of lncRNA-Disease Associations and Prediction of lncRNAs Implicated inDiseases. PLoS One. 2014;9:e87797. doi: 10.1371/journal.pone.0087797. [DOI] [PMC free article] [PubMed] [Google Scholar]
- 18.Jiang M, Huang O, Xie Z, Wu S, Zhang X, Shen A, Liu H, Chen X, Wu J, Lou Y, Mao Y, Sun K, Hu S, Geng M, Shen K. A novel long non-coding RNA-ARA: Adriamycin Resistance Associated. Biochem Pharmacol. 2014;87:254–283. doi: 10.1016/j.bcp.2013.10.020. [DOI] [PubMed] [Google Scholar]
- 19.Tönnies H, Lage H. Chromosomal imbalances associated with drug resistance and thermoresistance in human pancreatic carcinoma cells. Eur J Cell Biol. 2004;83:591–601. doi: 10.1078/0171-9335-00414. [DOI] [PubMed] [Google Scholar]
- 20.Yang Y, Li H, Hou S, Hu B, Liu J, Wang J. The noncoding RNA expression profile and the effect of lncRNA AK126698 on cisplatin resistance in non- small-cell lung cancer cell. PLoS One. 2013;8:e65309. doi: 10.1371/journal.pone.0065309. [DOI] [PMC free article] [PubMed] [Google Scholar]
- 21.Ashburner M, Ball CA, Blake JA, Botstein D, Butler H, Cherry JM, Davis AP, Dolinski K, Dwight SS, Eppig JT, Harris MA, Hill DP, Issel-Tarver L, Kasarskis A, Lewis S, Matese JC, Richardson JE, Ringwald M, Rubin GM, Sherlock G. Gene Ontology: Tool for the unification of biology. The Gene Ontology Consortium. Nat Genet. 2000;25:25–29. doi: 10.1038/75556. [DOI] [PMC free article] [PubMed] [Google Scholar]
- 22.Cao G, Zhang J, Wang M, Song X, Liu W, Mao C, Lv C. Differential expression of long non-coding RNAs in bleomycin-induced lung fibrosis. Int J Mol Med. 2013;32:355–364. doi: 10.3892/ijmm.2013.1404. [DOI] [PubMed] [Google Scholar]
- 23.Kozinn SI, Harty NJ, Delong JM, Deliyiannis C, Logvinenko T, Summerhayes IC, Libertino JA, Holway AH, Rieger-Christ KM. MicroRNA Profile to Predict Gemcitabine Resistance in Bladder Carcinoma Cell Lines. Genes Cancer. 2013;4:61–9. doi: 10.1177/1947601913484495. [DOI] [PMC free article] [PubMed] [Google Scholar]
- 24.Qin L, Dong Z, Zhang JT. Reversible epigenetic regulation of 14-3-3σ expression in acquired gemcitabine resistance by Uhrf1 and DNA methyltransferase 1. Mol Pharmacol. 2014;86:561–9. doi: 10.1124/mol.114.092544. [DOI] [PMC free article] [PubMed] [Google Scholar]
- 25.Niero EL, Rocha-Sales B, Lauand C, Cortez BA, de Souza MM, Rezende-Teixeira P, Urabayashi MS, Martens AA, Neves JH, Machado-Santelli GM. The multiple facets of drug resistance: one history, different approaches. J Exp Clin Cancer Res. 2014;33:37. doi: 10.1186/1756-9966-33-37. [DOI] [PMC free article] [PubMed] [Google Scholar]
- 26.Giovannetti E, Funel N, Peters GJ, Del Chiaro M, Erozenci LA, Vasile E, Leon LG, Pollina LE, Groen A, Falcone A, Danesi R, Campani D, Verheul HM, Boggi U. microRNA-21 in pancreatic cancer: correlation with clinical outcome and pharmacologic aspects underlying its role in the modulation of gemcitabine activity. Cancer Res. 2010;70:4528–38. doi: 10.1158/0008-5472.CAN-09-4467. [DOI] [PubMed] [Google Scholar]
- 27.Preis M, Gardner TB, Gordon SR, Pipas JM, Mackenzie TA, Klein EE, Longnecker DS, Gutmann EJ, Sempere LF, Korc M. MicroRNA-10b expression correlates with response to neoadjuvant therapy and survival in pancreatic ductal adenocarcinoma. Clin Cancer Res. 2011;17:5812–5821. doi: 10.1158/1078-0432.CCR-11-0695. [DOI] [PMC free article] [PubMed] [Google Scholar]
- 28.Ji Q, Hao X, Zhang M, Tang W, Yang M, Li L, Xiang D, Desano JT, Bommer GT, Fan D, Fearon ER, Lawrence TS, Xu L. MicroRNA miR-34 inhibits human pancreatic cancer tumor-initiating cells. PLoS One. 2009;4:e6816. doi: 10.1371/journal.pone.0006816. [DOI] [PMC free article] [PubMed] [Google Scholar]
- 29.Sarkar FH, Li Y, Wang Z, Kong D. Pancreatic cancer stem cells and EMT in drug resistance and metastasis. Minerva Chir. 2009;64:489–500. [PMC free article] [PubMed] [Google Scholar]
- 30.Long J, Zhang Y, Yu X, Yang J, LeBrun DG, Chen C, Yao Q, Li M. Overcoming drug resistance in pancreatic cancer. Expert Opin Ther Targets. 2011;15:817–828. doi: 10.1517/14728222.2011.566216. [DOI] [PMC free article] [PubMed] [Google Scholar]
- 31.Yang Y, Li H, Hou S, Hu B, Liu J, Wang J. The noncoding RNA expression profile and the effect of lncRNA AK126698 on cisplatin resistance in non-small-cell lung cancer cell. PLoS One. 2013;8:e65309. doi: 10.1371/journal.pone.0065309. [DOI] [PMC free article] [PubMed] [Google Scholar]
- 32.Cui J, Jiang W, Wang S, Wang L, Xie K. Role of Wnt/β-catenin signaling in drug resistance of pancreatic cancer. Curr Pharm Des. 2012;18:2464–71. doi: 10.2174/13816128112092464. [DOI] [PubMed] [Google Scholar]
- 33.Jiang M, Huang O, Xie Z, Wu S, Zhang X, Shen A, Liu H, Chen X, Wu J, Lou Y, Mao Y, Sun K, Hu S, Geng M, Shen K. A novel long non-coding RNA-ARA: adriamycin resistance associated. Biochemical Pharmacology. 2014;87:254–283. doi: 10.1016/j.bcp.2013.10.020. [DOI] [PubMed] [Google Scholar]
- 34.Kim K, Jutooru I, Chadalapaka G, Johnson G, Frank J, Burghardt R, Kim S, Safe S. HOTAIR is a negative prognostic factor and exhibits pro-oncogenic activity in pancreatic cancer. Oncogene. 2013;32:1616–1625. doi: 10.1038/onc.2012.193. [DOI] [PMC free article] [PubMed] [Google Scholar]
- 35.Fan Y, Shen B, Tan M, Mu X, Qin Y, Zhang F, Liu Y. Long non-coding RNA UCA1 increases chemoresistance of bladder cancer cells by regulating Wnt signaling. FEBS J. 2014;281:1750–8. doi: 10.1111/febs.12737. [DOI] [PubMed] [Google Scholar]
- 36.Li W, Yue W, Zhang L, Zhao X, Ma L, Yang X, Zhang C, Wang Y, Gu M. Polymorphisms in GSTM1, CYP1A1, CYP2E1, and CYP2D6 are associated with susceptibility and chemotherapy response in non-small-cell lung cancer patients. Lung. 2012;190:91–98. doi: 10.1007/s00408-011-9338-8. [DOI] [PubMed] [Google Scholar]
- 37.Xu D, Hu J, De Bruyne E, Menu E, Schots R, Vanderkerken K, Van Valckenborgh E. Dll1/Notch activation contributes to bortezomib resistance by upregulating CYP1A1 in multiple myeloma. Biochem Biophys Res Commun. 2012;428:518–524. doi: 10.1016/j.bbrc.2012.10.071. [DOI] [PubMed] [Google Scholar]
- 38.Bu HQ, Luo J, Chen H, Zhang JH, Li HH, Guo HC, Wang ZH, Lin SZ. Oridonin enhances antitumor activity of gemcitabine in pancreatic cancer through MAPK-p38 signaling pathway. Int J Oncol. 2012;41:949–58. doi: 10.3892/ijo.2012.1519. [DOI] [PubMed] [Google Scholar]
- 39.Chang GC, Hsu SL, Tsai JR, Wu WJ, Chen CY, Sheu GT. Extracellular signal-regulated kinase activation and Bcl-2 downregulation mediate apoptosis after gemcitabine treatment partly via a p53-independent pathway. Eur J Pharmacol. 2004;502:169–183. doi: 10.1016/j.ejphar.2004.09.006. [DOI] [PubMed] [Google Scholar]
- 40.Camps C, Sarries C, Roig B, Sanchez JJ, Queralt C, Sancho E, Martinez N, Tarón M, Rosell R. Assessment of nucleotide excision repair XPD polymorphisms in the peripheral blood of gemcitabine/cisplatin-treated advanced non-sma- ll-cell lung cancer patients. Clin Lung Cancer. 2003;4:237–41. doi: 10.3816/clc.2003.n.004. [DOI] [PubMed] [Google Scholar]
- 41.Yokoi K, Fidler IJ. Hypoxia increases resistance of human pancreatic cancer cells to apoptosis induced by gemcitabine. Clin Cancer Res. 2004;10:2299–306. doi: 10.1158/1078-0432.ccr-03-0488. [DOI] [PubMed] [Google Scholar]
- 42.Smith SC, Petrova AV, Madden MZ, Wang H, Pan Y, Warren MD, Hardy CW, Liang D, Liu EA, Robinson MH, Rudra S, Wang J, Ehdaivand S, Torres MA, Wang Y, Yu DS. A gemcitabine sensitivity screen identifies a role for NEK9 in the replication stress response. Nucleic Acids Res. 2014;42:11517–27. doi: 10.1093/nar/gku840. [DOI] [PMC free article] [PubMed] [Google Scholar]


